

Jupiter technical analysis: Downward pressure intensifies as sellers dominate

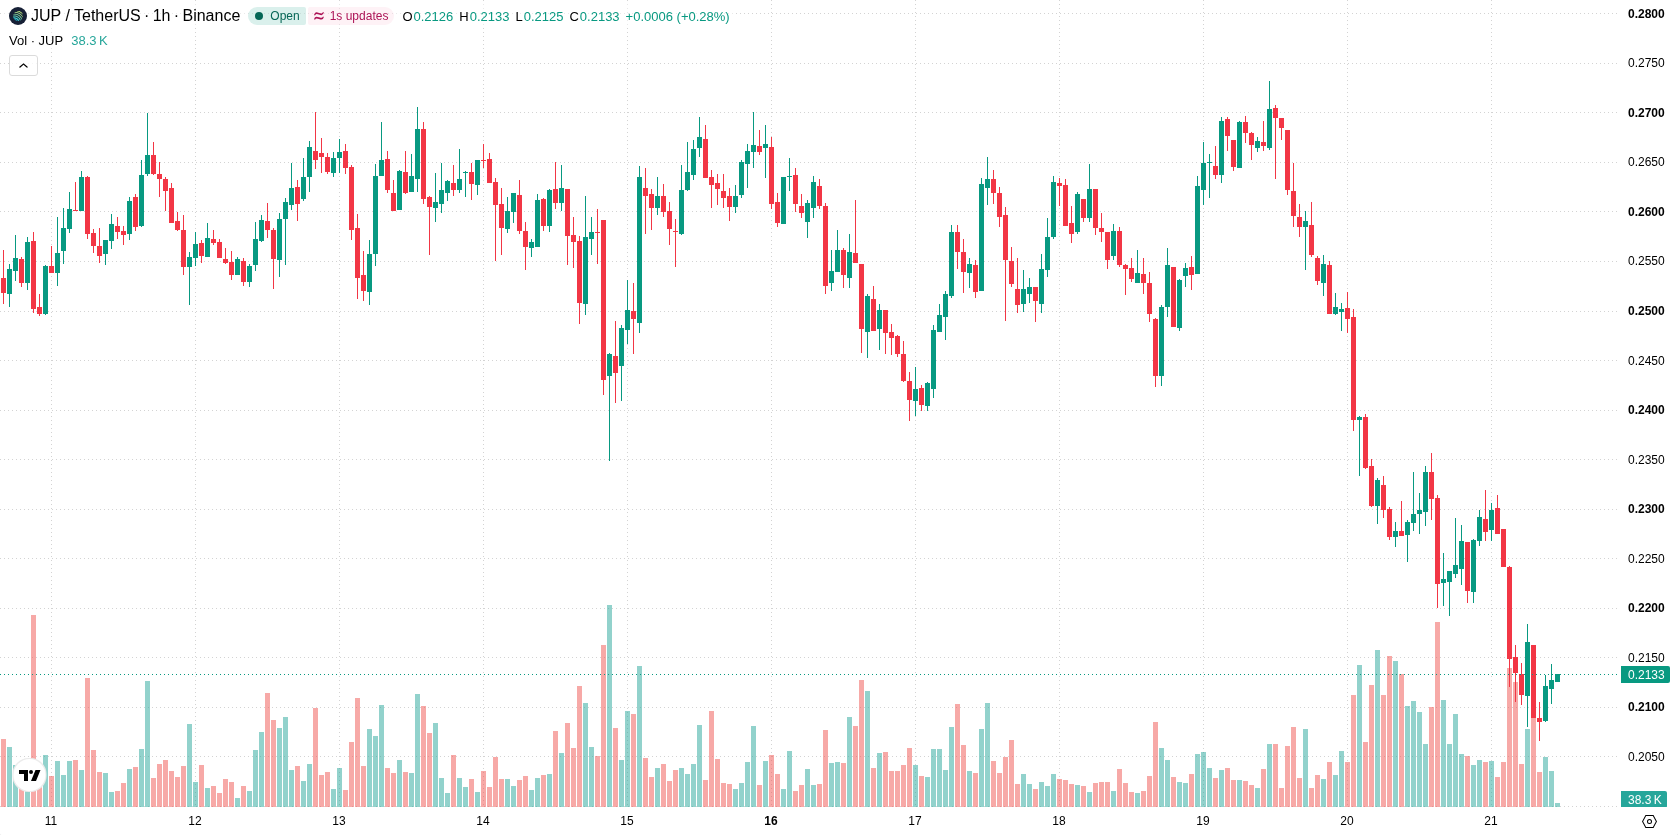
Jupiter (JUP) is trading at $0.2126, marking a daily decline of 6.96%. The asset remains positioned below its key moving averages, reflecting sustained downside momentum in the short and long term.
 0.2314
0.2732
Highlights
- Jupiter daily trading volume doubled its 30-day average, indicating increased market activity and higher liquidity pressures.
- The rise in transaction volume has contributed to elevated volatility, making price direction more sensitive to sentiment shifts.
- JUP/USD trades below key moving averages with sustained negative momentum, a high probability of decline to $0.2005 to $0.2247, and sellers dominating intraday.
Liquidity pressures intensify as trading volume surges above average
Jupiter has recorded a sharp increase in daily trading volume, reaching nearly twice its 30-day average, according to Diariobitcoin. This substantial uptick in transaction activity points to intensified liquidity pressures, which can sway price direction quickly depending on prevailing sentiment. The heightened volume environment characterizes the current trading landscape and amplifies market volatility.
Resistance limits and negative indicators reinforce intraday selling bias
On the hourly chart, JUP is trading below the H1 SMA-20 at $0.2202 and H1 SMA-50 at $0.2358, with the daily SMA-200 at $0.2327 also above the current price. The Ichimoku Kijun sits at $0.2211 and acts as immediate resistance. MACD and ADX readings remain negative, indicating ongoing selling momentum. RSI, Stoch RSI, and CCI are all classified as neutral, while Bull/Bear Power at -0.004 confirms sellers maintain intraday dominance. The Awesome Oscillator is neutral, providing little directional input.
Sideways range likely as breakout probability skews lower
For the next two to three trading days, the expected price range for JUP is $0.2005 to $0.2247, reflecting a typical volatility band relative to current levels. The probability of an upward breakout is rated below 20%, while a downward move has a probability above 80%. The most likely scenario is sideways price action within this band. A bullish shift would require a sustained move above immediate resistance, whereas a drop below range support would trigger a bearish continuation.
Earlier, analysts noted that Jupiter was exhibiting persistent technical weakness and elevated downside risk despite ongoing protocol developments. The current increase in trading volume underscores intensified volatility, making the immediate $0.2005 support a critical level for traders to monitor in the days ahead.






Latest Jupiter News




-
 Afghanistan
-
 Albania
-
 Algeria
-
 Angola
-
 Argentina
-
 Armenia
-
 Australia
-
 Austria
-
 Azerbaijan
-
 Bahamas
-
 Bahrain
-
 Bangladesh
-
 Belarus
-
 Belgium
-
 Bolivia
-
 Botswana
-
 Brazil
-
 Brunei
-
 Bulgaria
-
 Cambodia
-
 Cameroon
-
 Canada
-
 Chile
-
 China
-
 Colombia
-
 Congo
-
 Costa Rica
-
 Cote d'Ivoire
-
 Croatia
-
 Cuba
-
 Cyprus
-
 Czechia
-
 DR Congo
-
 Denmark
-
 Dominican Republic
-
 Ecuador
-
 Egypt
-
 El Salvador
-
 Estonia
-
 Eswatini
-
 Ethiopia
-
 Finland
-
 France
-
 Georgia
-
 Germany
-
 Ghana
-
 Greece
-
 Haiti
-
 Hong Kong
-
 Hungary
-
 India
-
 Indonesia
-
 Iran, Islamic republic
-
 Iraq
-
 Ireland
-
 Israel
-
 Italy
-
 Jamaica
-
 Japan
-
 Jordan
-
 Kazakhstan
-
 Kenya
-
 Korea
-
 Kuwait
-
 Kyrgyzstan
-
 Laos
-
 Latvia
-
 Lebanon
-
 Lesotho
-
 Libya
-
 Lithuania
-
 Luxembourg
-
 Madagascar
-
 Malaysia
-
 Malta
-
 Mauritius
-
 Mexico
-
 Moldova
-
 Mongolia
-
 Montenegro
-
 Morocco
-
 Mozambique
-
 Myanmar
-
 Namibia
-
 Nepal
-
 Netherlands
-
 New Zealand
-
 Nigeria
-
 North Macedonia
-
 Norway
-
 Oman
-
 Pakistan
-
 Palestine
-
 Panama
-
 Papua New Guinea
-
 Paraguay
-
 Peru
-
 Philippines
-
 Poland
-
 Portugal
-
 Puerto Rico
-
 Qatar
-
 Reunion
-
 Romania
-
 Rwanda
-
 Saudi Arabia
-
 Serbia
-
 Singapore
-
 Slovakia
-
 Slovenia
-
 Somalia
-
 South Africa
-
 Spain
-
 Sri Lanka
-
 Sweden
-
 Switzerland
-
 Syria
-
 Taiwan
-
 Tajikistan
-
 Tanzania
-
 Thailand
-
 Trinidad and Tobago
-
 Tunisia
-
 Turkey
-
 UAE
-
 Uganda
-
 Ukraine
-
 United Kingdom
-
United States
-
 Uruguay
-
 Uzbekistan
-
 Venezuela
-
 Vietnam
-
 Yemen
-
 Zambia
-
 Zimbabwe
- Forex
- Crypto












