

Will Jito extend losses amid prevailing seller dominance and weak recovery prospects?

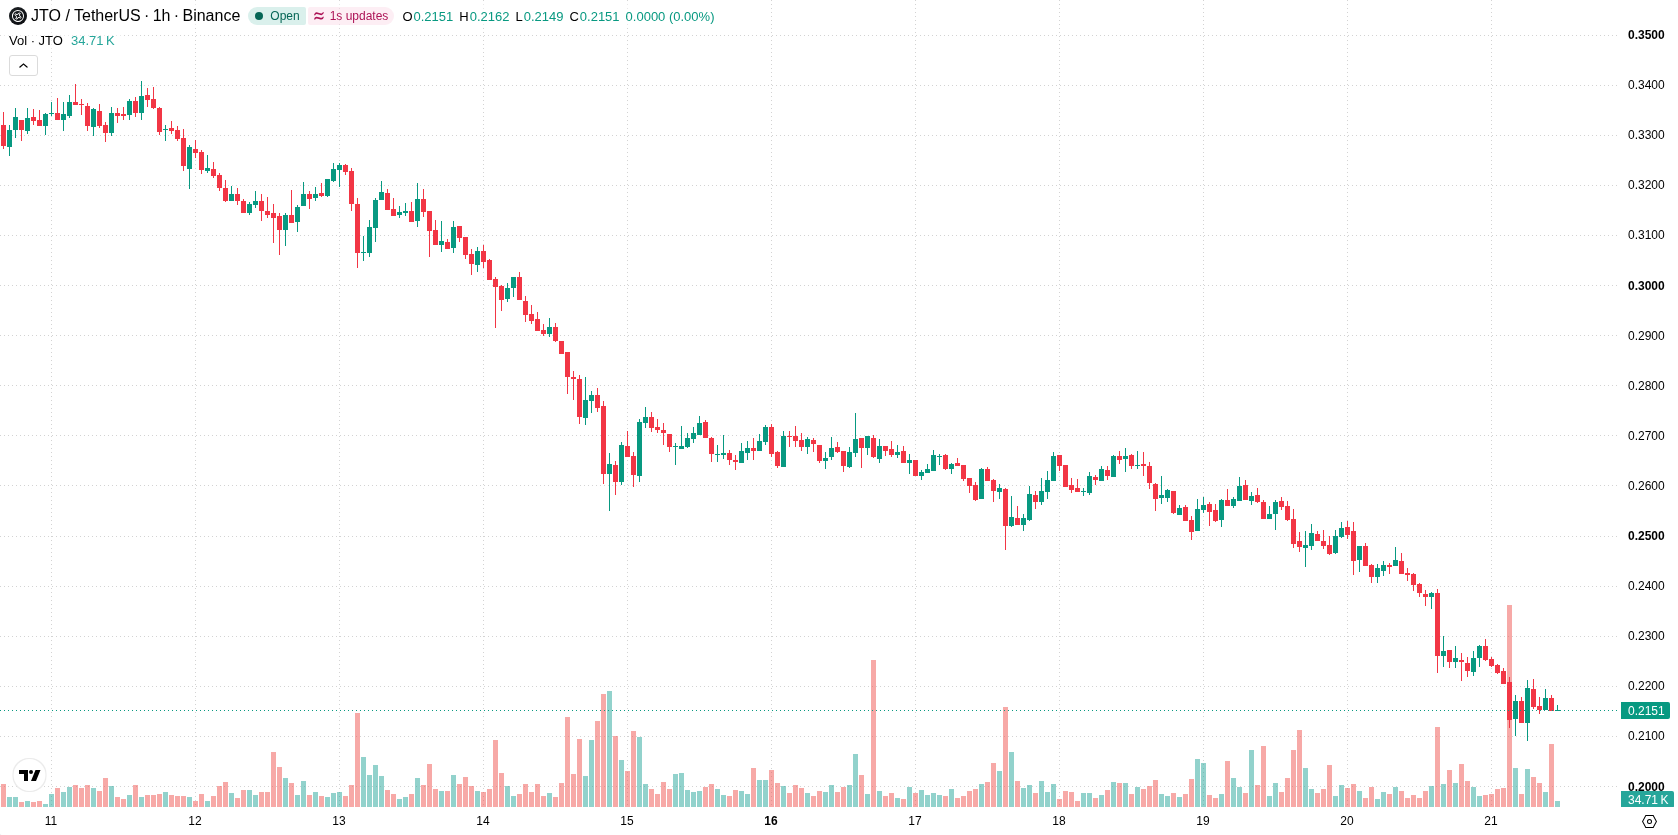
Jito (JTO) is trading at $0.2151, down 10.82% for the day. The price sits below its key short- and long-term moving averages, underscoring continued downward momentum in the market.
 0.2257
0.2756
Highlights
- JTO/USD trades below key moving averages across all timeframes, confirming persistent bearish pressure and lack of recovery momentum.
- Negative momentum signals including MACD and ADX support a strong sell trend, while oscillators remain mostly neutral, creating mixed technical signals.
- Price is at $0.2151, down 10.82% today, with an expected range of $0.1827 to $0.2273 and high probability of further downside.
Resistance and bearish signals reinforce downward momentum
On the technical front, JTO/USD is trading below the H1 SMA-20 at $0.2213 and H1 SMA-50 at $0.2369, as well as well beneath the D1 SMA-200 at $0.5218. The Ichimoku Kijun level at $0.2277 marks immediate resistance, reinforcing a notable obstacle for any upward price movement. Momentum indicators show a strong negative bias, with MACD and ADX both signaling a sell condition. Bull/Bear Power is negative, highlighting prevailing seller dominance in intraday action. RSI and CCI are neutral, while the Stochastic RSI sits in the overbought zone, suggesting the potential for a near-term correction lower, though it does not signal a reversal by itself. The Awesome Oscillator is neutral, contributing to an overall picture of mixed oscillator readings amidst prevailing downside momentum.
Lower price risk dominates amid persistent volatility
Over the next 2–3 trading days, JTO is anticipated to fluctuate within a volatility band between $0.1827 and $0.2273. The probability of a move higher is assessed as very low, while the odds of further downside remain very high. The baseline scenario is for JTO to remain within this range as volatility continues. A bullish scenario would require a decisive break above the $0.2277 resistance, while a bearish outcome could see the price fall below the $0.1827 support level.
Earlier, analysts noted that Jito (JTO) was under sustained bearish pressure, with technical signals reinforcing downside risk. The current analysis strengthens this outlook, highlighting that persistent negative momentum makes a clear break below the $0.1827 support the most significant risk to monitor in the short term.










-
 Afghanistan
-
 Albania
-
 Algeria
-
 Angola
-
 Argentina
-
 Armenia
-
 Australia
-
 Austria
-
 Azerbaijan
-
 Bahamas
-
 Bahrain
-
 Bangladesh
-
 Belarus
-
 Belgium
-
 Bolivia
-
 Botswana
-
 Brazil
-
 Brunei
-
 Bulgaria
-
 Cambodia
-
 Cameroon
-
 Canada
-
 Chile
-
 China
-
 Colombia
-
 Congo
-
 Costa Rica
-
 Cote d'Ivoire
-
 Croatia
-
 Cuba
-
 Cyprus
-
 Czechia
-
 DR Congo
-
 Denmark
-
 Dominican Republic
-
 Ecuador
-
 Egypt
-
 El Salvador
-
 Estonia
-
 Eswatini
-
 Ethiopia
-
 Finland
-
 France
-
 Georgia
-
 Germany
-
 Ghana
-
 Greece
-
 Haiti
-
 Hong Kong
-
 Hungary
-
 India
-
 Indonesia
-
 Iran, Islamic republic
-
 Iraq
-
 Ireland
-
 Israel
-
 Italy
-
 Jamaica
-
 Japan
-
 Jordan
-
 Kazakhstan
-
 Kenya
-
 Korea
-
 Kuwait
-
 Kyrgyzstan
-
 Laos
-
 Latvia
-
 Lebanon
-
 Lesotho
-
 Libya
-
 Lithuania
-
 Luxembourg
-
 Madagascar
-
 Malaysia
-
 Malta
-
 Mauritius
-
 Mexico
-
 Moldova
-
 Mongolia
-
 Montenegro
-
 Morocco
-
 Mozambique
-
 Myanmar
-
 Namibia
-
 Nepal
-
 Netherlands
-
 New Zealand
-
 Nigeria
-
 North Macedonia
-
 Norway
-
 Oman
-
 Pakistan
-
 Palestine
-
 Panama
-
 Papua New Guinea
-
 Paraguay
-
 Peru
-
 Philippines
-
 Poland
-
 Portugal
-
 Puerto Rico
-
 Qatar
-
 Reunion
-
 Romania
-
 Rwanda
-
 Saudi Arabia
-
 Serbia
-
 Singapore
-
 Slovakia
-
 Slovenia
-
 Somalia
-
 South Africa
-
 Spain
-
 Sri Lanka
-
 Sweden
-
 Switzerland
-
 Syria
-
 Taiwan
-
 Tajikistan
-
 Tanzania
-
 Thailand
-
 Trinidad and Tobago
-
 Tunisia
-
 Turkey
-
 UAE
-
 Uganda
-
 Ukraine
-
 United Kingdom
-
United States
-
 Uruguay
-
 Uzbekistan
-
 Venezuela
-
 Vietnam
-
 Yemen
-
 Zambia
-
 Zimbabwe
- Forex
- Crypto












