

Raydium exploited for $1.34 million: Can RAY avoid further losses?

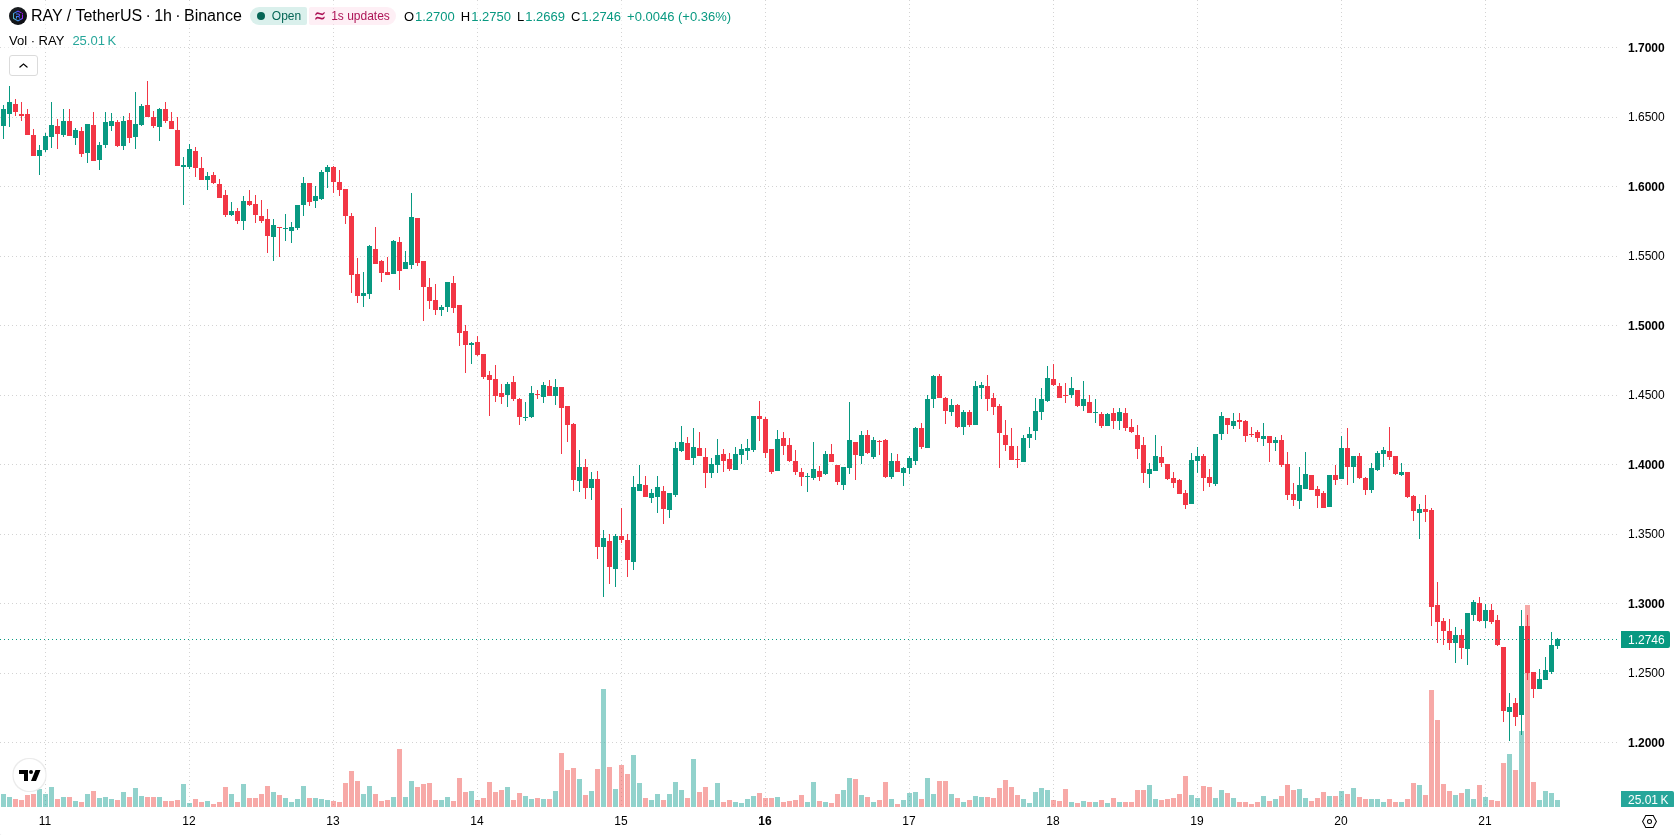
Raydium (RAY) is trading at $1.2698, down 6.95% on the day and showing heightened volatility. The price currently holds above its key short- and long-term moving averages but remains under pressure from intermediate-term trends.
 1.2996
1.4718
Highlights
- Raydium suffered a $1.34 million loss from an exploit targeting a retired smart contract tied to five liquidity pools.
- Raydium's treasury reimbursed affected liquidity providers to limit disruption, but security concerns persist following the breach.
- RAY trades at $1.2698, down 6.95% today, with technicals indicating strong downward momentum and a 65% probability of further downside toward $1.2112 over 2 to 3 days.
Liquidity exploit drives risk aversion amid shaken market confidence
On June 10, 2026, Raydium suffered a $1.34 million loss as a result of an exploit targeting a retired smart contract associated with five liquidity pools, according to Dev. The incident led Raydium's treasury to reimburse affected liquidity providers, mitigating further disruption but drawing attention to lingering security concerns. This breach has weighed on user confidence and contributed to negative sentiment within the market, intensifying risk aversion amid ongoing price declines.
Seller dominance persists as mixed signals and resistance converge
Technically, RAY trades above the H1 SMA-20 at $1.2658 and the D1 SMA-200 at $1.0942, but holds below the H1 SMA-50 at $1.3402. Immediate resistance is defined by the Ichimoku Kijun at $1.3007. The MACD shows a strong sell signal, while the ADX also presents a sell outlook, reinforcing seller dominance. Both the RSI and CCI remain in neutral territory, and Stochastic RSI is overbought, suggesting only this oscillator is at an extreme. Bull/Bear Power is slightly negative, pointing to modest intraday seller control. This mixture of strong momentum selling and neutral oscillator readings signals mixed technical conditions with latent volatility.
Directional risk favors downside as price nears volatility threshold
For the next 2 to 3 trading days, the expected volatility band is $1.2112 to $1.3181, with a 65% probability of further downside and a 35% chance of an upward move. Price stabilization could occur if RAY remains within this corridor. A break above $1.3007 would indicate renewed bullish momentum, while a drop below $1.2112 would likely reinforce further selling pressure.
Earlier, analysts noted that Raydium faced persistent selling pressure following a significant smart contract exploit and subsequent treasury intervention. The current analysis strengthens this view with heightened volatility and ongoing mixed technical signals, highlighting the risk that a sustained break below $1.2112 could trigger further downside in the near term.










-
 Afghanistan
-
 Albania
-
 Algeria
-
 Angola
-
 Argentina
-
 Armenia
-
 Australia
-
 Austria
-
 Azerbaijan
-
 Bahamas
-
 Bahrain
-
 Bangladesh
-
 Belarus
-
 Belgium
-
 Bolivia
-
 Botswana
-
 Brazil
-
 Brunei
-
 Bulgaria
-
 Cambodia
-
 Cameroon
-
 Canada
-
 Chile
-
 China
-
 Colombia
-
 Congo
-
 Costa Rica
-
 Cote d'Ivoire
-
 Croatia
-
 Cuba
-
 Cyprus
-
 Czechia
-
 DR Congo
-
 Denmark
-
 Dominican Republic
-
 Ecuador
-
 Egypt
-
 El Salvador
-
 Estonia
-
 Eswatini
-
 Ethiopia
-
 Finland
-
 France
-
 Georgia
-
 Germany
-
 Ghana
-
 Greece
-
 Haiti
-
 Hong Kong
-
 Hungary
-
 India
-
 Indonesia
-
 Iran, Islamic republic
-
 Iraq
-
 Ireland
-
 Israel
-
 Italy
-
 Jamaica
-
 Japan
-
 Jordan
-
 Kazakhstan
-
 Kenya
-
 Korea
-
 Kuwait
-
 Kyrgyzstan
-
 Laos
-
 Latvia
-
 Lebanon
-
 Lesotho
-
 Libya
-
 Lithuania
-
 Luxembourg
-
 Madagascar
-
 Malaysia
-
 Malta
-
 Mauritius
-
 Mexico
-
 Moldova
-
 Mongolia
-
 Montenegro
-
 Morocco
-
 Mozambique
-
 Myanmar
-
 Namibia
-
 Nepal
-
 Netherlands
-
 New Zealand
-
 Nigeria
-
 North Macedonia
-
 Norway
-
 Oman
-
 Pakistan
-
 Palestine
-
 Panama
-
 Papua New Guinea
-
 Paraguay
-
 Peru
-
 Philippines
-
 Poland
-
 Portugal
-
 Puerto Rico
-
 Qatar
-
 Reunion
-
 Romania
-
 Rwanda
-
 Saudi Arabia
-
 Serbia
-
 Singapore
-
 Slovakia
-
 Slovenia
-
 Somalia
-
 South Africa
-
 Spain
-
 Sri Lanka
-
 Sweden
-
 Switzerland
-
 Syria
-
 Taiwan
-
 Tajikistan
-
 Tanzania
-
 Thailand
-
 Trinidad and Tobago
-
 Tunisia
-
 Turkey
-
 UAE
-
 Uganda
-
 Ukraine
-
 United Kingdom
-
United States
-
 Uruguay
-
 Uzbekistan
-
 Venezuela
-
 Vietnam
-
 Yemen
-
 Zambia
-
 Zimbabwe
- Forex
- Crypto












