

Raydium technical analysis: Downtrend extends with $1.09 support in focus

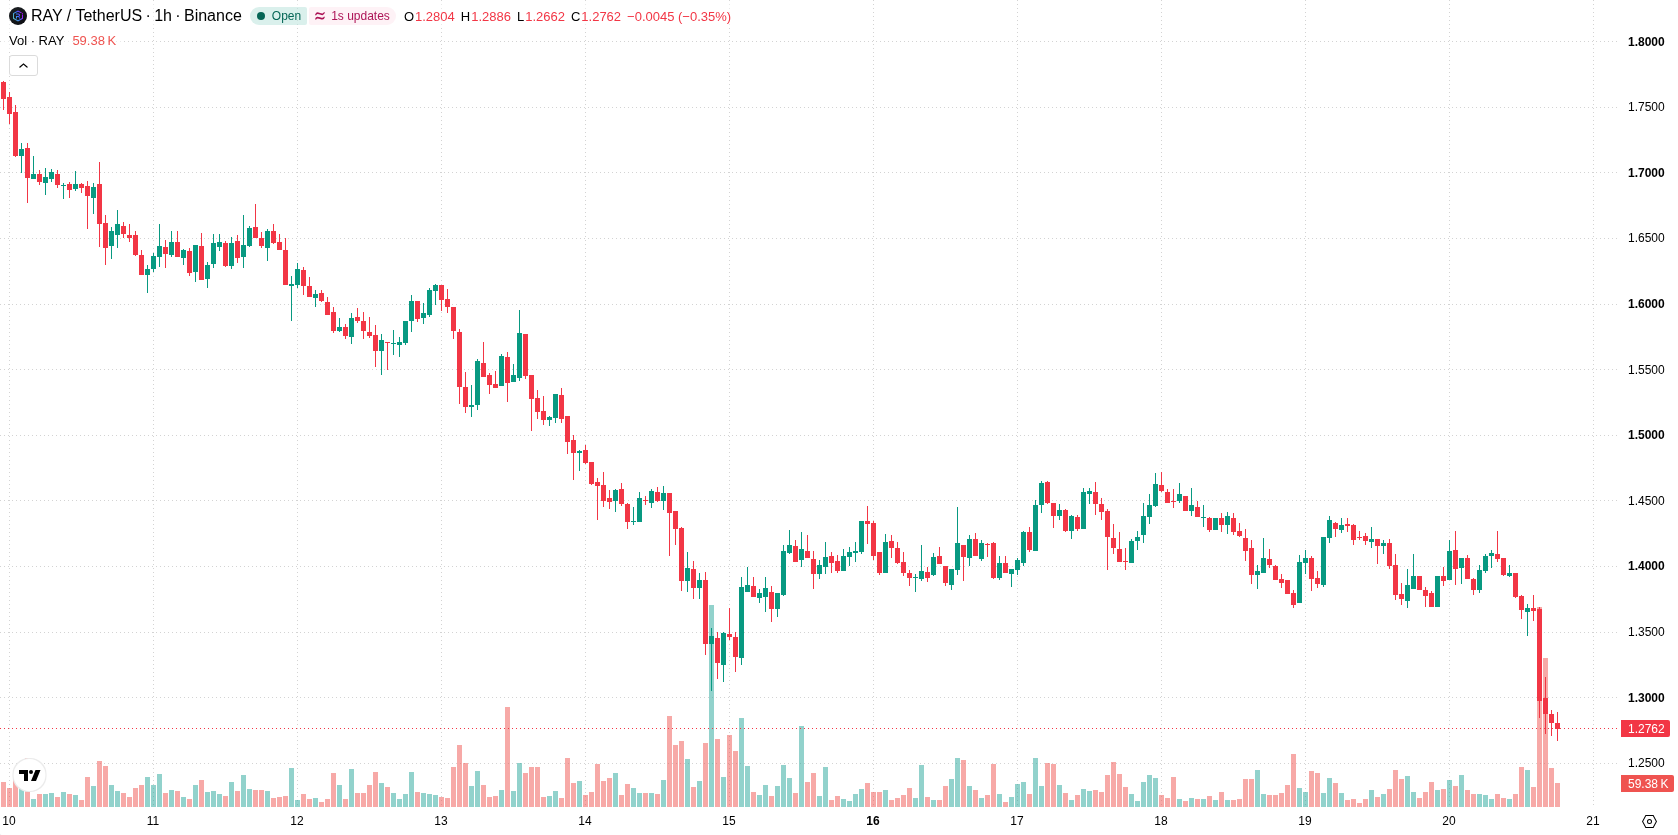
Raydium (RAY) is trading at $1.2775, sharply down 8.38% on the day. The asset is currently positioned below its key short- and medium-term moving averages, which indicates continued pressure versus shorter timeframes but maintains a cushion above longer-term trend levels.
 1.427
1.4925
Highlights
- RAY/USD trades below key short- and medium-term moving averages, indicating ongoing downward momentum in the short term.
- Momentum and trend indicators confirm a sell bias, though all oscillators are in oversold territory, suggesting possible selling exhaustion.
- The forecasted range for the next 2 to 3 days is $1.1186 to $1.3195, with a strong probability of further downside and limited rebound potential.
Bearish momentum and oversold signals amid layered resistance
On the technical front, RAY/USD is trading below both the H1 SMA-20 at $1.3763 and the H1 SMA-50 at $1.3914, indicating immediate resistance from these levels. The price remains above the D1 SMA-200 at $1.0918, which serves as longer-term structural support. The Ichimoku Kijun level at $1.3493 is now acting as resistance. MACD and ADX both register sell signals, reflecting negative momentum, while RSI, Stoch RSI, and CCI are each in their oversold zones—suggesting selling exhaustion could be approaching, but without a confirmed reversal. Bull/Bear Power is negative at -0.0609, highlighting intraday selling dominance, and the Awesome Oscillator is also aligned with the bearish tone.
Further downside likely as breakout above resistance looks remote
In the short term, the forecasted range for RAY/USD over the next two to three trading days is $1.1186 to $1.3195, reflecting the current volatility band relative to recent levels. There is a very low probability of an immediate upward reversal, while further downside remains highly probable unless the price decisively breaks above the $1.3493 resistance. If RAY/USD falls below the $1.1186 support, additional pressure and declines are likely; otherwise, consolidation within the stated range should be expected.
Earlier, analysts noted that Raydium was displaying a constructive technical backdrop supported by robust transaction activity and strengthening protocol utility. The current shift to pronounced downside pressure and oversold conditions marks a reversal of that outlook, making the $1.1186 support level pivotal for assessing further risk over the next several sessions.










-
 Afghanistan
-
 Albania
-
 Algeria
-
 Angola
-
 Argentina
-
 Armenia
-
 Australia
-
 Austria
-
 Azerbaijan
-
 Bahamas
-
 Bahrain
-
 Bangladesh
-
 Belarus
-
 Belgium
-
 Bolivia
-
 Botswana
-
 Brazil
-
 Brunei
-
 Bulgaria
-
 Cambodia
-
 Cameroon
-
 Canada
-
 Chile
-
 China
-
 Colombia
-
 Congo
-
 Costa Rica
-
 Cote d'Ivoire
-
 Croatia
-
 Cuba
-
 Cyprus
-
 Czechia
-
 DR Congo
-
 Denmark
-
 Dominican Republic
-
 Ecuador
-
 Egypt
-
 El Salvador
-
 Estonia
-
 Eswatini
-
 Ethiopia
-
 Finland
-
 France
-
 Georgia
-
 Germany
-
 Ghana
-
 Greece
-
 Haiti
-
 Hong Kong
-
 Hungary
-
 India
-
 Indonesia
-
 Iran, Islamic republic
-
 Iraq
-
 Ireland
-
 Israel
-
 Italy
-
 Jamaica
-
 Japan
-
 Jordan
-
 Kazakhstan
-
 Kenya
-
 Korea
-
 Kuwait
-
 Kyrgyzstan
-
 Laos
-
 Latvia
-
 Lebanon
-
 Lesotho
-
 Libya
-
 Lithuania
-
 Luxembourg
-
 Madagascar
-
 Malaysia
-
 Malta
-
 Mauritius
-
 Mexico
-
 Moldova
-
 Mongolia
-
 Montenegro
-
 Morocco
-
 Mozambique
-
 Myanmar
-
 Namibia
-
 Nepal
-
 Netherlands
-
 New Zealand
-
 Nigeria
-
 North Macedonia
-
 Norway
-
 Oman
-
 Pakistan
-
 Palestine
-
 Panama
-
 Papua New Guinea
-
 Paraguay
-
 Peru
-
 Philippines
-
 Poland
-
 Portugal
-
 Puerto Rico
-
 Qatar
-
 Reunion
-
 Romania
-
 Rwanda
-
 Saudi Arabia
-
 Serbia
-
 Singapore
-
 Slovakia
-
 Slovenia
-
 Somalia
-
 South Africa
-
 Spain
-
 Sri Lanka
-
 Sweden
-
 Switzerland
-
 Syria
-
 Taiwan
-
 Tajikistan
-
 Tanzania
-
 Thailand
-
 Trinidad and Tobago
-
 Tunisia
-
 Turkey
-
 UAE
-
 Uganda
-
 Ukraine
-
 United Kingdom
-
United States
-
 Uruguay
-
 Uzbekistan
-
 Venezuela
-
 Vietnam
-
 Yemen
-
 Zambia
-
 Zimbabwe
- Forex
- Crypto












