

Litecoin falls over 5% as sector-wide selling pressure and outflows hit crypto markets

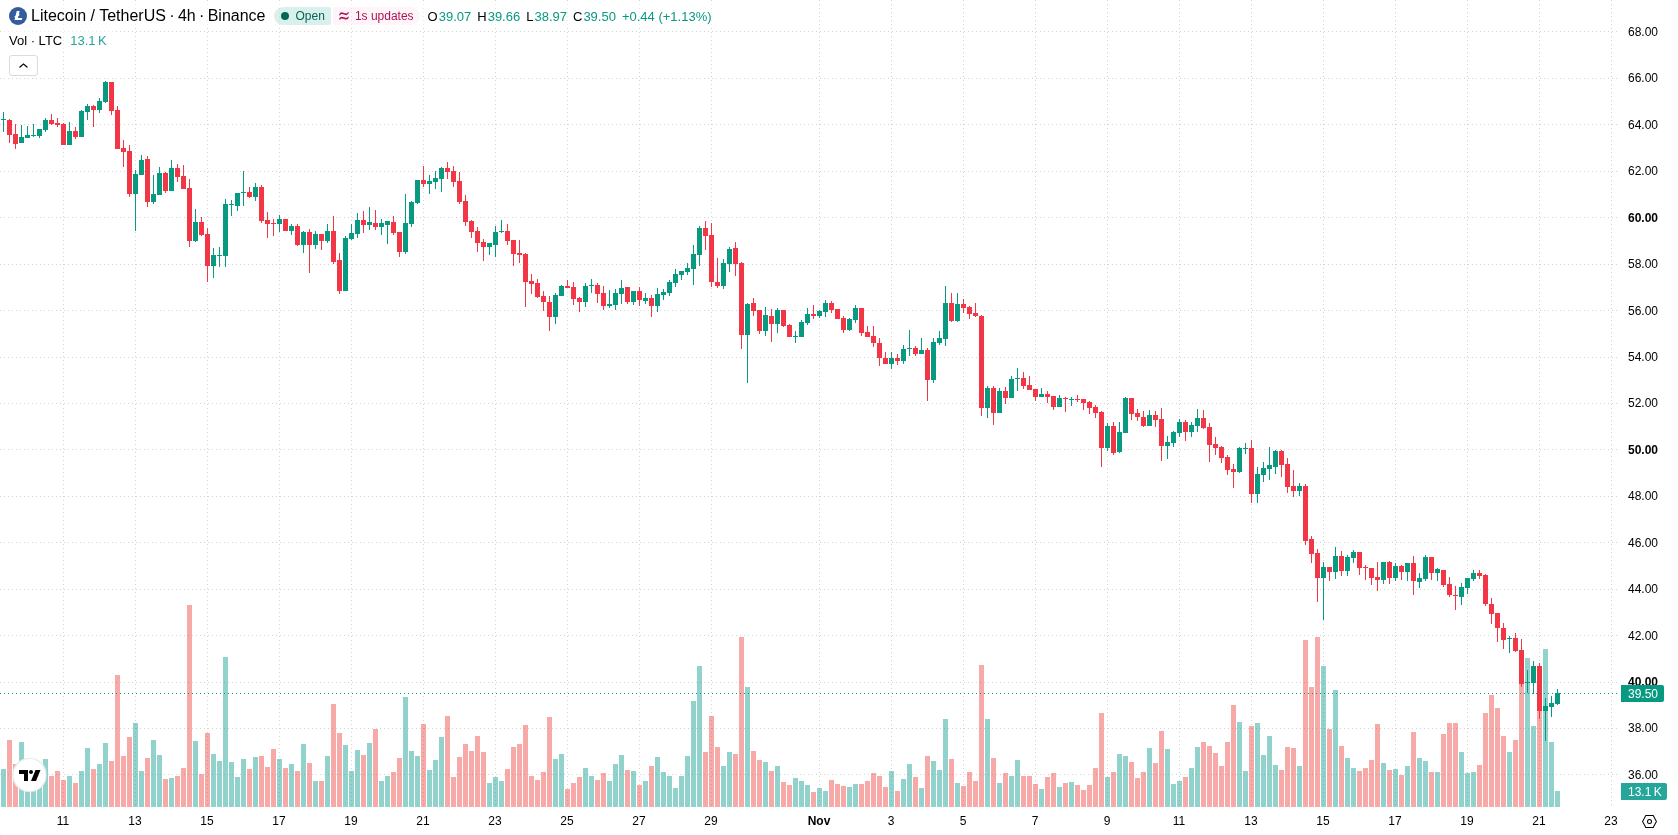
Litecoin (LTC) declined 5.21% amid sector-wide selling pressure and heavy outflows from major cryptocurrencies. The down move is supported by persistent technical weakness, with the price remaining below all major moving averages and key resistance levels.
 40.8
45.80
Highlights
- Litecoin fell sharply to the $40 to $43 range on November 20, 2026, coinciding with over 50% drop in derivatives open interest and above-average trading volume.
- Broader crypto market outflows and substantial Bitcoin ETF withdrawals provided market context, with no direct asset-specific news driving the decline.
- LTC/USD remains below key trend levels with strong bearish signals; the five-day range is projected at $34.38 to $42.48, with sellers dominant and rebound risk emerging as technical exhaustion builds.
Broader crypto outflows spur LTC drop amid muted network activity
Recent reports show Litecoin experienced a steep fall into the $40–$43 range in the period around November 20, 2026, as derivatives market open interest dropped by over 50% and trading volumes exceeded 30-day averages. No asset-specific corporate or regulatory news events were identified as direct triggers for the move. Broader cryptocurrency market outflows, including significant withdrawals from Bitcoin ETFs, were cited as context. The Litecoin Foundation's community bot launch was reported, but data indicated no impact on network activity or token demand.
Bearish momentum confirmed as indicators point to selling exhaustion
LTC/USD remains under pressure, with the current price at $39.31 sitting below the 20-day ($49.24), 50-day ($56.59), and 200-day ($51.57) moving averages. This configuration signals persistent bearish momentum across all timeframes, with the near-term ceiling at $39.45 and the immediate floor at $37.42. The longer-term moving averages and the Ichimoku Kijun at $49.71 confirm a continued downtrend. Momentum indicators show strong downside bias as the MACD and Average Directional Index (ADX) both indicate a sell signal. The Relative Strength Index (RSI), Stochastic RSI, and Commodity Channel Index (CCI) are each in their oversold zones, suggesting the pair is experiencing selling exhaustion and possible rebound risk, rather than confirming further downside. Bull/Bear Power (BBP) at -3.79 indicates sellers dominate intraday momentum. The Awesome Oscillator also signals further selling. The pair is down $2.16 today, following a downside gap of about 1.98%. The price sits at mid-range within today's high-low span, and intraday volatility remains elevated at 9.03%. Selling pressure has persisted after the open.
Earlier, analysts noted that Litecoin was under persistent bearish pressure driven by technical weakness and capped recovery attempts. The current analysis reinforces this view with evidence of ongoing downside momentum and oversold indicators, highlighting $37.42 as the critical support level to monitor for a potential breakdown in the coming sessions.











-
 Afghanistan
-
 Albania
-
 Algeria
-
 Angola
-
 Argentina
-
 Armenia
-
 Australia
-
 Austria
-
 Azerbaijan
-
 Bahamas
-
 Bahrain
-
 Bangladesh
-
 Belarus
-
 Belgium
-
 Bolivia
-
 Botswana
-
 Brazil
-
 Brunei
-
 Bulgaria
-
 Cambodia
-
 Cameroon
-
 Canada
-
 Chile
-
 China
-
 Colombia
-
 Congo
-
 Costa Rica
-
 Cote d'Ivoire
-
 Croatia
-
 Cuba
-
 Cyprus
-
 Czechia
-
 DR Congo
-
 Denmark
-
 Dominican Republic
-
 Ecuador
-
 Egypt
-
 El Salvador
-
 Estonia
-
 Eswatini
-
 Ethiopia
-
 Finland
-
 France
-
 Georgia
-
 Germany
-
 Ghana
-
 Greece
-
 Haiti
-
 Hong Kong
-
 Hungary
-
 India
-
 Indonesia
-
 Iran, Islamic republic
-
 Iraq
-
 Ireland
-
 Israel
-
 Italy
-
 Jamaica
-
 Japan
-
 Jordan
-
 Kazakhstan
-
 Kenya
-
 Korea
-
 Kuwait
-
 Kyrgyzstan
-
 Laos
-
 Latvia
-
 Lebanon
-
 Lesotho
-
 Libya
-
 Lithuania
-
 Luxembourg
-
 Madagascar
-
 Malaysia
-
 Malta
-
 Mauritius
-
 Mexico
-
 Moldova
-
 Mongolia
-
 Montenegro
-
 Morocco
-
 Mozambique
-
 Myanmar
-
 Namibia
-
 Nepal
-
 Netherlands
-
 New Zealand
-
 Nigeria
-
 North Macedonia
-
 Norway
-
 Oman
-
 Pakistan
-
 Palestine
-
 Panama
-
 Papua New Guinea
-
 Paraguay
-
 Peru
-
 Philippines
-
 Poland
-
 Portugal
-
 Puerto Rico
-
 Qatar
-
 Reunion
-
 Romania
-
 Rwanda
-
 Saudi Arabia
-
 Serbia
-
 Singapore
-
 Slovakia
-
 Slovenia
-
 Somalia
-
 South Africa
-
 Spain
-
 Sri Lanka
-
 Sweden
-
 Switzerland
-
 Syria
-
 Taiwan
-
 Tajikistan
-
 Tanzania
-
 Thailand
-
 Trinidad and Tobago
-
 Tunisia
-
 Turkey
-
 UAE
-
 Uganda
-
 Ukraine
-
 United Kingdom
-
United States
-
 Uruguay
-
 Uzbekistan
-
 Venezuela
-
 Vietnam
-
 Yemen
-
 Zambia
-
 Zimbabwe
- Forex
- Crypto












