


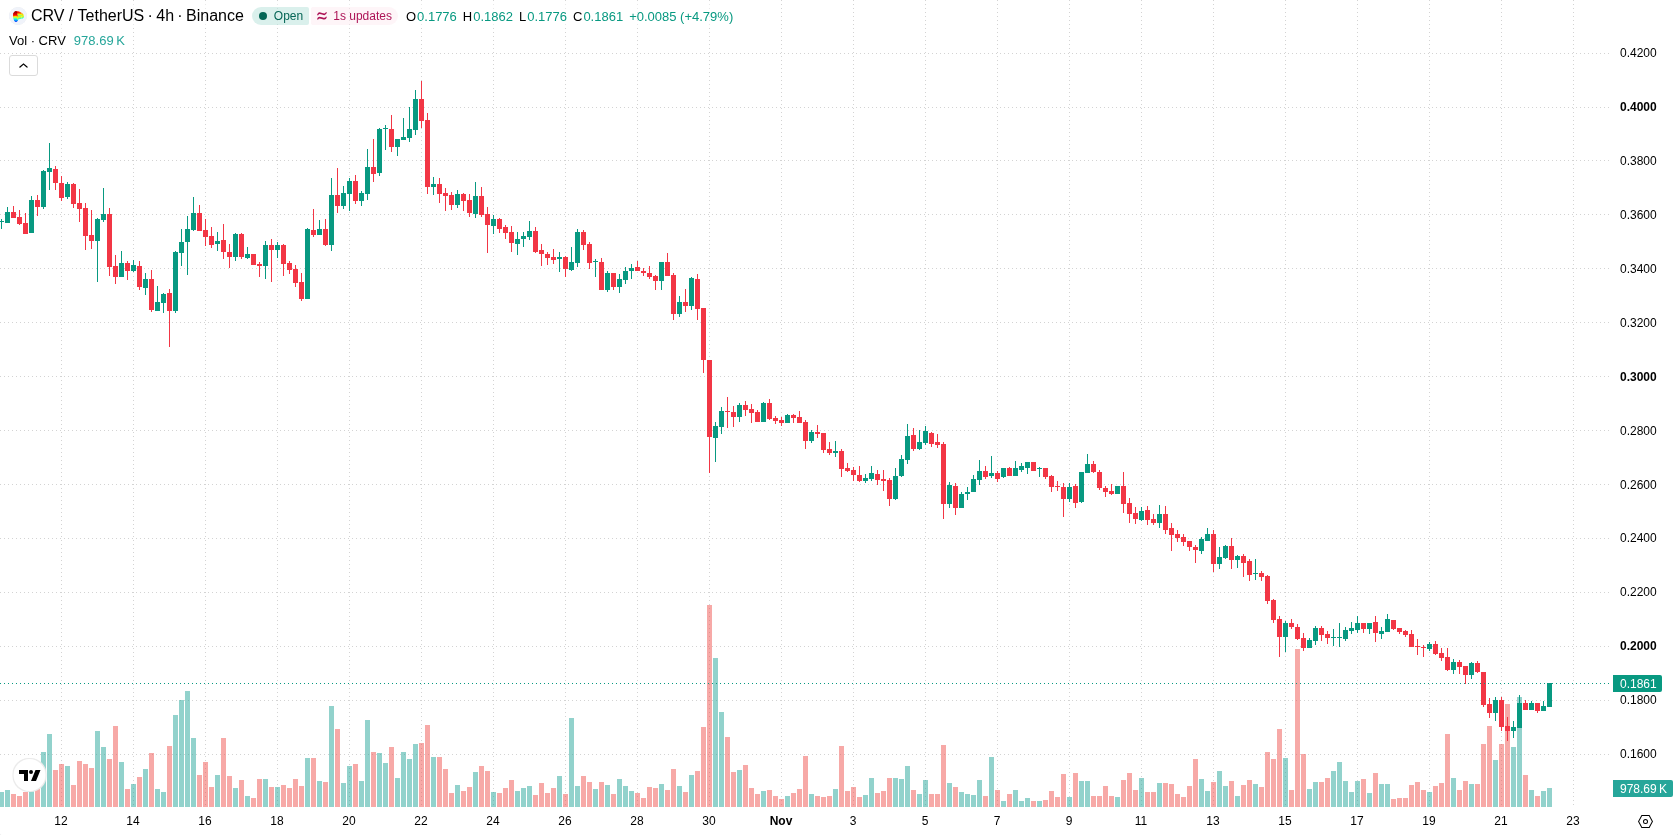
Curve (CRV) advanced 9.77% amid renewed focus on its role in DeFi stablecoin liquidity and ongoing revenue distribution. The move faces limits, with the token still trading well below its 20-day, 50-day, and 200-day moving averages.
 0.1878
0.2119
Highlights
- Curve remains a key decentralized finance platform for stablecoin liquidity, generating revenue and distributing fees through established methods.
- Curve's sector influence could strengthen if decentralized finance and stablecoin adoption increase further.
- CRV/USD trades below major moving averages with most momentum indicators oversold; expected five-day range is $0.1548 to $0.2091 and probability favors continued downward movement.
Revenue generation and sector adoption bolster Curve’s standing
Recent developments position Curve as an important platform for stablecoin liquidity within decentralized finance. The protocol continues to generate actual revenue and distributes fees through established mechanisms. Its positioning may improve further if DeFi and stablecoin adoption grows, affirming Curve's influence in the sector.
Oversold conditions deepen as multiple timeframes signal weakness
CRV/USD is trading well below the 20-day, 50-day, and 200-day moving averages, currently under $0.2318, $0.3024, and $0.269. This reflects sustained seller pressure across short, medium, and long timeframes. Near-term resistance stands at $0.2091, while intraday support aligns with today's high at $0.1795. Despite a bullish alignment between the 50-day and 200-day moving averages indicating a supportive long-term structure, current price action remains in a bearish zone. Momentum indicators, including MACD, ADX, RSI, Stochastic RSI, and CCI, all show dominant selling pressure with deeply oversold oscillator conditions. The Bull/Bear Power reading supports ongoing intraday weakness, while the Awesome Oscillator remains neutral. The session saw a noticeable gain and firm tone, accompanied by 2.63% intraday volatility and prices closing near session highs.
Earlier, analysts noted that Curve was consolidating following a period of selling pressure, with neutral momentum signals setting the stage for potential breakout or renewed volatility. The current analysis strengthens this view by highlighting persistent downside risk and dominant selling pressure, making a decisive move above $0.2091 or below $0.1548 the key levels to monitor for a clearer directional bias.








-
 Afghanistan
-
 Albania
-
 Algeria
-
 Angola
-
 Argentina
-
 Armenia
-
 Australia
-
 Austria
-
 Azerbaijan
-
 Bahamas
-
 Bahrain
-
 Bangladesh
-
 Belarus
-
 Belgium
-
 Bolivia
-
 Botswana
-
 Brazil
-
 Brunei
-
 Bulgaria
-
 Cambodia
-
 Cameroon
-
 Canada
-
 Chile
-
 China
-
 Colombia
-
 Congo
-
 Costa Rica
-
 Cote d'Ivoire
-
 Croatia
-
 Cuba
-
 Cyprus
-
 Czechia
-
 DR Congo
-
 Denmark
-
 Dominican Republic
-
 Ecuador
-
 Egypt
-
 El Salvador
-
 Estonia
-
 Eswatini
-
 Ethiopia
-
 Finland
-
 France
-
 Georgia
-
 Germany
-
 Ghana
-
 Greece
-
 Haiti
-
 Hong Kong
-
 Hungary
-
 India
-
 Indonesia
-
 Iran, Islamic republic
-
 Iraq
-
 Ireland
-
 Israel
-
 Italy
-
 Jamaica
-
 Japan
-
 Jordan
-
 Kazakhstan
-
 Kenya
-
 Korea
-
 Kuwait
-
 Kyrgyzstan
-
 Laos
-
 Latvia
-
 Lebanon
-
 Lesotho
-
 Libya
-
 Lithuania
-
 Luxembourg
-
 Madagascar
-
 Malaysia
-
 Malta
-
 Mauritius
-
 Mexico
-
 Moldova
-
 Mongolia
-
 Montenegro
-
 Morocco
-
 Mozambique
-
 Myanmar
-
 Namibia
-
 Nepal
-
 Netherlands
-
 New Zealand
-
 Nigeria
-
 North Macedonia
-
 Norway
-
 Oman
-
 Pakistan
-
 Palestine
-
 Panama
-
 Papua New Guinea
-
 Paraguay
-
 Peru
-
 Philippines
-
 Poland
-
 Portugal
-
 Puerto Rico
-
 Qatar
-
 Reunion
-
 Romania
-
 Rwanda
-
 Saudi Arabia
-
 Serbia
-
 Singapore
-
 Slovakia
-
 Slovenia
-
 Somalia
-
 South Africa
-
 Spain
-
 Sri Lanka
-
 Sweden
-
 Switzerland
-
 Syria
-
 Taiwan
-
 Tajikistan
-
 Tanzania
-
 Thailand
-
 Trinidad and Tobago
-
 Tunisia
-
 Turkey
-
 UAE
-
 Uganda
-
 Ukraine
-
 United Kingdom
-
United States
-
 Uruguay
-
 Uzbekistan
-
 Venezuela
-
 Vietnam
-
 Yemen
-
 Zambia
-
 Zimbabwe
- Forex
- Crypto












