

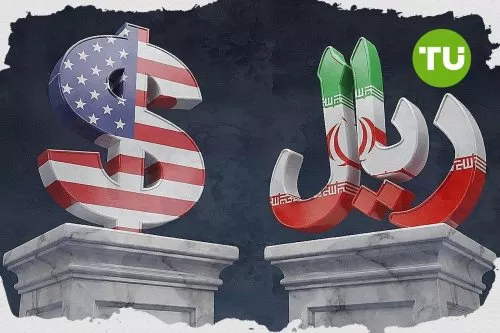
US dollar to Iranian Rial exchange rate holds near IRR1,375,997 resistance as US-Iran negotiations announcement eases tensions

US Dollar vs Iranian Rial (USD/IRR) is trading at IRR1,374,913, marking a modest gain for the day. The pair remains above its key moving averages, indicating firm support levels despite low volatility.
 1895089.0680
1896055.6297
Highlights
- US-Iran negotiations announced by President Trump reduce geopolitical tensions, supporting a shift away from safe-haven demand in USD/IRR trading.
- Easing risk aversion is likely to affect capital flows and drive adjustments in both the US dollar and Iranian rial valuations.
- Technicals indicate short- to long-term bullish pressure, with a 71% probability USD/IRR stays within IRR1,368,039–1,381,788; main resistance is near IRR1,375,997.
Market sentiment improves as US-Iran negotiations ease geopolitical fears
US President Donald Trump has announced that negotiations with Iran will begin, easing geopolitical concerns and boosting market sentiment, according to Econotimes. Such diplomatic developments can shift trader focus away from risk aversion, affecting flows into both the US dollar and Iranian rial. As market participants adjust to reduced perceived geopolitical risk, price movements in USD/IRR may reflect these changing expectations.
Technical resistance and mixed momentum fuel indecision in trading
On the hourly chart, USD/IRR is trading above its MA-20 at IRR1,374,054 and MA-50 at IRR1,374,609, while remaining well above the long-term MA-200 at IRR1,225,635. The daily Ichimoku Kijun at IRR1,375,997 now acts as immediate resistance. Momentum indicators present a mixed picture: MACD signals a strong sell, ADX is neutral, while RSI at 53 and CCI both suggest buying conditions, and the Stochastic RSI is overbought. Bull/Bear Power indicates buyers dominate intraday price action, with the Awesome Oscillator showing a neutral stance.
Sideways movement expected as probability shifts favor bulls
Over the next 2–3 trading days, USD/IRR is projected to fluctuate between IRR1,368,039 and IRR1,381,788, in line with typical volatility for this pair. The baseline scenario envisions sideways movement within this defined band, with a 71% probability of upward movement and a 29% chance of a downward shift. A breakout above the Kijun resistance would point to bullish continuation, while a drop below support at the lower end of the range could trigger a short-term bearish phase.










-
 Afghanistan
-
 Albania
-
 Algeria
-
 Angola
-
 Argentina
-
 Armenia
-
 Australia
-
 Austria
-
 Azerbaijan
-
 Bahamas
-
 Bahrain
-
 Bangladesh
-
 Belarus
-
 Belgium
-
 Bolivia
-
 Botswana
-
 Brazil
-
 Brunei
-
 Bulgaria
-
 Cambodia
-
 Cameroon
-
 Canada
-
 Chile
-
 China
-
 Colombia
-
 Congo
-
 Costa Rica
-
 Cote d'Ivoire
-
 Croatia
-
 Cuba
-
 Cyprus
-
 Czechia
-
 DR Congo
-
 Denmark
-
 Dominican Republic
-
 Ecuador
-
 Egypt
-
 El Salvador
-
 Estonia
-
 Eswatini
-
 Ethiopia
-
 Finland
-
 France
-
 Georgia
-
 Germany
-
 Ghana
-
 Greece
-
 Haiti
-
 Hong Kong
-
 Hungary
-
 India
-
 Indonesia
-
 Iran, Islamic republic
-
 Iraq
-
 Ireland
-
 Israel
-
 Italy
-
 Jamaica
-
 Japan
-
 Jordan
-
 Kazakhstan
-
 Kenya
-
 Korea
-
 Kuwait
-
 Kyrgyzstan
-
 Laos
-
 Latvia
-
 Lebanon
-
 Lesotho
-
 Libya
-
 Lithuania
-
 Luxembourg
-
 Madagascar
-
 Malaysia
-
 Malta
-
 Mauritius
-
 Mexico
-
 Moldova
-
 Mongolia
-
 Montenegro
-
 Morocco
-
 Mozambique
-
 Myanmar
-
 Namibia
-
 Nepal
-
 Netherlands
-
 New Zealand
-
 Nigeria
-
 North Macedonia
-
 Norway
-
 Oman
-
 Pakistan
-
 Palestine
-
 Panama
-
 Papua New Guinea
-
 Paraguay
-
 Peru
-
 Philippines
-
 Poland
-
 Portugal
-
 Puerto Rico
-
 Qatar
-
 Reunion
-
 Romania
-
 Rwanda
-
 Saudi Arabia
-
 Serbia
-
 Singapore
-
 Slovakia
-
 Slovenia
-
 Somalia
-
 South Africa
-
 Spain
-
 Sri Lanka
-
 Sweden
-
 Switzerland
-
 Syria
-
 Taiwan
-
 Tajikistan
-
 Tanzania
-
 Thailand
-
 Trinidad and Tobago
-
 Tunisia
-
 Turkey
-
 UAE
-
 Uganda
-
 Ukraine
-
 United Kingdom
-
United States
-
 Uruguay
-
 Uzbekistan
-
 Venezuela
-
 Vietnam
-
 Yemen
-
 Zambia
-
 Zimbabwe
- Forex
- Crypto












