
Meta stock attempts to stabilize as technical recovery collides with regulatory overhang

Meta stock price is attempting to find its footing after a sharp and disruptive selloff in November that decisively broke the prior bullish structure. The stock is now trading near the mid-$660s, recovering from a late-November low near $585, but the rebound remains fragile as price pushes into a dense overhead resistance zone shaped by declining moving averages and renewed regulatory uncertainty in Europe.
Highlights
- Meta shares rebound toward $660 after November selloff erased prior bullish structure.
- Recovery stalls below $675–$680 as declining EMAs and Supertrend cap upside.
- EU court ruling on personalized ads adds fresh regulatory pressure during technical reset.
The November decline marked a clear shift in market behavior. After failing near the $760–$770 region, Meta shares unwound rapidly, triggering a wave of liquidation that erased weeks of gains and forced a reset in short-term positioning.
While buyers have since stepped in to stabilize price, the market is still digesting the technical and fundamental implications of that breakdown rather than resuming a clean trend higher.
Technical damage still defines the recovery
On the 4-hour chart, the extent of the November breakdown remains evident. Meta sliced through its rising medium-term trend and lost the 20-, 50- and 100-period exponential moving averages in quick succession. That move flipped Supertrend decisively bearish and confirmed a transition from trend continuation into corrective unwinding. Selling pressure only began to ease near the $580 area, where aggressive dip-buying emerged and established a higher-low structure heading into December.
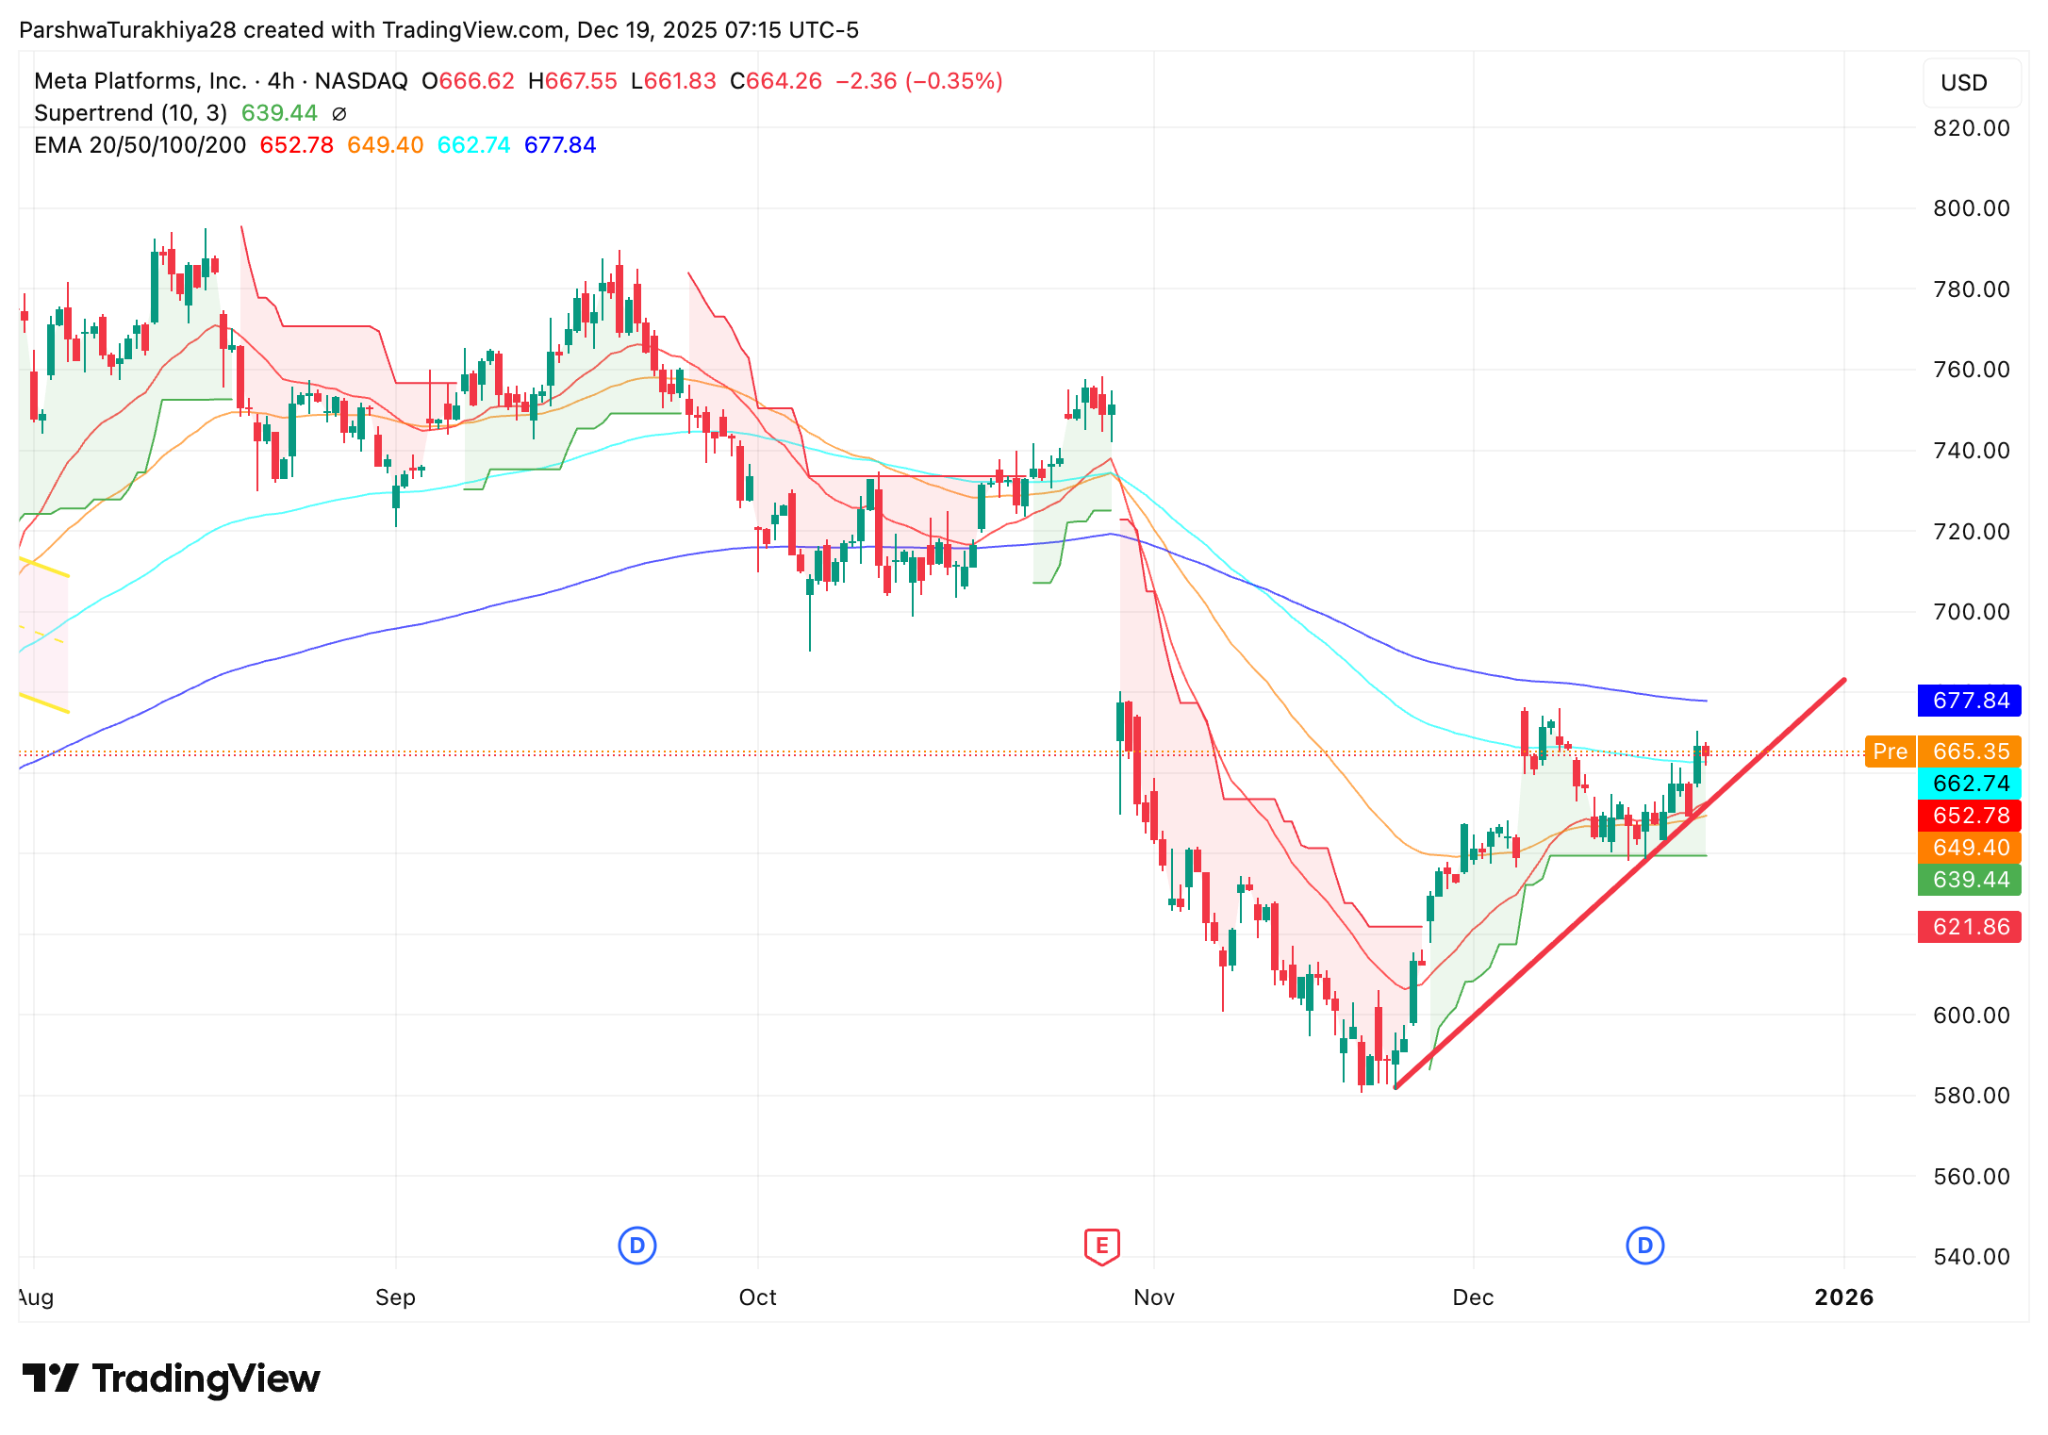
Meta price dynamics (Source: TradingView)
Since that low, price action has improved in a controlled manner. Meta has climbed along a rising short-term trendline, reclaiming the 20-period EMA near $653 and briefly stabilizing above the 50-period EMA around $649. The character of the rebound has been orderly rather than impulsive, pointing to short covering and tactical positioning rather than a broad return of longer-term trend buyers.
The current challenge lies overhead. The 100-period EMA near $663 and the 200-period EMA near $678 form a tight resistance band that has capped every rally attempt over the past two weeks. Price is now pressing into this zone, but acceptance above it has yet to materialize. The broader EMA alignment remains bearish, with longer-term averages still sloping lower, reinforcing the idea that the recovery is incomplete.
Momentum signals echo this caution. Supertrend resistance continues to reassert itself on pullbacks, and repeated failures near the mid-$660s suggest sellers remain active. Until Meta can demonstrate sustained trade above long-term resistance, upside progress is likely to remain incremental and vulnerable to setbacks.
Regulatory ruling complicates sentiment
The fundamental backdrop helps explain the market’s hesitation. A recent ruling by Austria’s Supreme Court against Meta’s personalised advertising practices has reintroduced regulatory risk across the European Union. While the company has stressed that the case relates to older data policies and highlighted significant investments in privacy compliance, the decision establishes an enforceable EU-wide precedent.
For investors, the concern is less about immediate fines and more about long-term constraints on data monetisation and higher compliance costs. The ruling arrives at a sensitive moment, just as Meta shares are attempting to rebuild technical credibility after a sharp drawdown. Regulatory uncertainty has historically weighed on valuation multiples in the sector, and its re-emergence limits the willingness of buyers to chase the stock aggressively.
At the same time, Meta’s broader business fundamentals remain intact, with advertising demand holding up and cost discipline supporting margins. This balance explains why the selloff has stalled rather than extended. However, until regulatory clarity improves, the stock is likely to trade with a higher risk premium.
Key levels and what comes next
From a technical perspective, the $675–$680 zone remains pivotal. A sustained move above this area, particularly a hold above the 200-period EMA, would signal that the recovery has gained traction and open room toward $710, where the prior breakdown accelerated. Failure to clear resistance would keep Meta vulnerable to a pullback toward the rising trendline near $640, with deeper support closer to $610 if sentiment weakens again.
Previously, we noted that Meta’s inability to hold above the $750 region left the stock exposed to a deeper corrective phase if regulatory pressure intensified. That scenario has now played out. The current rebound suggests stabilization, but not yet resolution. For now, Meta is trading in a transitional phase, where the worst of the liquidation has passed, but confidence has not fully returned.
Until price can decisively reclaim long-term resistance and regulatory risks become clearer, the rebound should be viewed as a corrective recovery within a broader consolidation rather than confirmation that the prior uptrend has resumed.


-
 Afghanistan
-
 Albania
-
 Algeria
-
 Angola
-
 Argentina
-
 Armenia
-
 Australia
-
 Austria
-
 Azerbaijan
-
 Bahamas
-
 Bahrain
-
 Bangladesh
-
 Belarus
-
 Belgium
-
 Bolivia
-
 Botswana
-
 Brazil
-
 Brunei
-
 Bulgaria
-
 Cambodia
-
 Cameroon
-
 Canada
-
 Chile
Chile
-
 China
China
-
 Colombia
-
 Congo
Congo
-
 Costa Rica
-
 Cote d'Ivoire
-
 Croatia
-
 Cuba
Cuba
-
 Cyprus
-
 Czechia
-
 DR Congo
-
 Denmark
-
 Dominican Republic
-
 Ecuador
-
 Egypt
Egypt
-
 El Salvador
-
 Estonia
-
 Eswatini
-
 Ethiopia
-
 Finland
-
 France
-
 Georgia
-
 Germany
-
 Ghana
Ghana
-
 Greece
-
 Haiti
Haiti
-
 Hong Kong
-
 Hungary
-
 India
India
-
 Indonesia
-
 Iran, Islamic republic
-
 Iraq
Iraq
-
 Ireland
-
 Israel
-
 Italy
Italy
-
 Jamaica
-
 Japan
Japan
-
 Jordan
-
 Kazakhstan
-
 Kenya
Kenya
-
 Korea
Korea
-
 Kuwait
-
 Kyrgyzstan
-
 Laos
Laos
-
 Latvia
-
 Lebanon
-
 Lesotho
-
 Libya
Libya
-
 Lithuania
-
 Luxembourg
-
 Madagascar
-
 Malaysia
-
 Malta
Malta
-
 Mauritius
-
 Mexico
-
 Moldova
-
 Mongolia
-
 Montenegro
-
 Morocco
-
 Mozambique
-
 Myanmar
-
 Namibia
-
 Nepal
Nepal
-
 Netherlands
-
 New Zealand
-
 Nigeria
-
 North Macedonia
-
 Norway
-
 Oman
Oman
-
 Pakistan
-
 Palestine
-
 Panama
-
 Papua New Guinea
-
 Paraguay
-
 Peru
Peru
-
 Philippines
-
 Poland
-
 Portugal
-
 Puerto Rico
-
 Qatar
Qatar
-
 Reunion
-
 Romania
-
 Rwanda
-
 Saudi Arabia
-
 Serbia
-
 Singapore
-
 Slovakia
-
 Slovenia
-
 Somalia
-
 South Africa
-
 Spain
Spain
-
 Sri Lanka
-
 Sweden
-
 Switzerland
-
 Syria
Syria
-
 Taiwan
-
 Tajikistan
-
 Tanzania
-
 Thailand
-
 Trinidad and Tobago
-
 Tunisia
-
 Turkey
-
 UAE
UAE
-
 Uganda
-
 Ukraine
-
 United Kingdom
-
United States
-
 Uruguay
-
 Uzbekistan
-
 Venezuela
-
 Vietnam
-
 Yemen
Yemen
-
 Zambia
-
 Zimbabwe
- Forex
- Crypto
