
META weekly report: stock slips below key moving averages amid persistent selling pressure

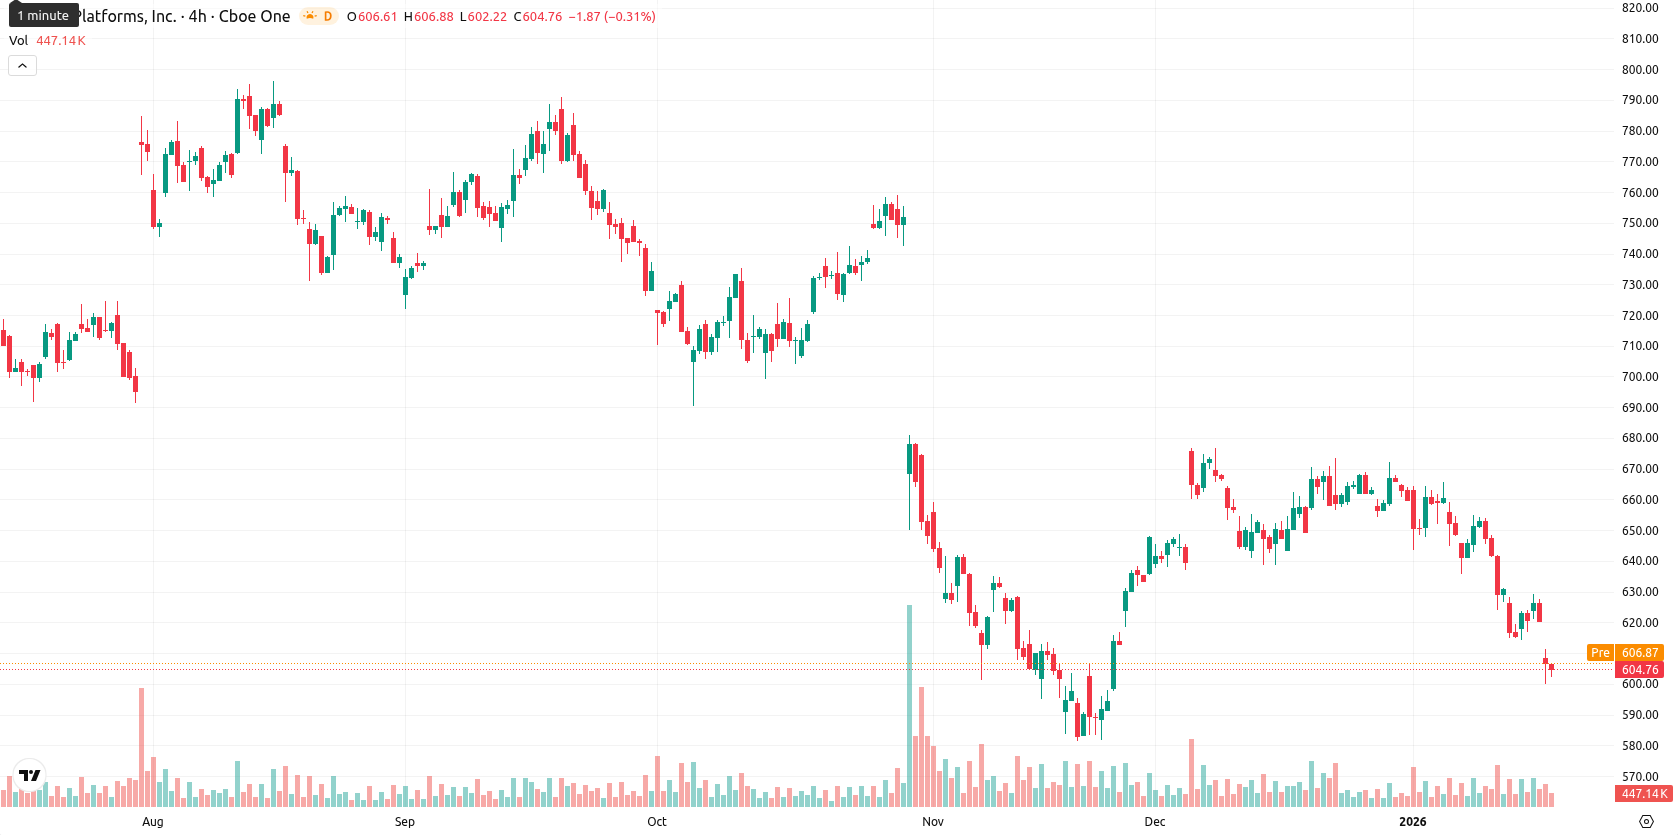
Meta Platforms Inc. (META) ended the week at $604.21, marking a drop of $16.21 or 2.61% from the previous week. The stock remains well below its W1 MA-20 at $672.08 and MA-50 at $666.75, highlighting continued selling pressure over the short and medium term.
Highlights
- Meta Platforms reported a 26% year-over-year revenue increase and 20% EPS growth for Q3 2025, while higher AI-related operating costs weighed on margins.
- The company significantly raised capital expenditures to expand AI infrastructure, launching new data centers and the Meta Compute network, and shifting investment from metaverse operations.
- Meta secured strategic nuclear power agreements for sustainable energy and continued shareholder returns via buybacks and dividends, amid ongoing regulatory challenges.
Robust revenue gains offset by AI investment surge and evolving cost pressures
Meta Platforms reported a 26% year-over-year increase in revenue and a 20% rise in EPS for Q3 2025, despite higher AI-related operating costs. The company has announced significantly higher capital expenditures focused on expanding AI infrastructure, including development of new data centers and the Meta Compute network, while reallocating resources from metaverse operations and increasing production of Ray-Ban smart glasses. Additional developments include strategic power purchase agreements with nuclear providers to secure sustainable energy, and ongoing shareholder returns through buybacks and dividends as the company navigates regulatory challenges.
Decisive weekly bearish momentum as oversold technicals signal weak trend
Weekly technical signals for META remain decisively bearish, with the stock trading below the MA-20 and MA-50, while the MA-200 serves as a distant long-term support at $418.46. The Ichimoku W1 Kijun at $688.59 represents the nearest dynamic resistance. Weekly indicators, including MACD in sell mode, a low ADX implying weak trend strength, and oversold readings from RSI and Stoch RSI, all point to persistent downward momentum, with sellers maintaining control throughout the week.
Range-bound outlook with downside risk as recovery prospects remain limited
For the next 5 to 7 trading days, META is expected to consolidate in a range between $590.00 and $620.00, reflecting heightened volatility and continued downside risk. The probability of a quick recovery above $620.00 is low, with baseline expectations favoring further sideways or downward movement. A bullish breakout would require a strong close above $620.00, targeting $640.00, while a breakdown below the $600.00–$590.00 support area could trigger further declines.
Previously it was noted that the prevailing short-term trend remains bearish, defined by a clear sequence of lower highs and lower lows. The article also discussed that momentum indicators are recovering from oversold conditions, suggesting selling pressure is easing even as the broader trend structure remains weak.


-
 Afghanistan
-
 Albania
-
 Algeria
-
 Angola
-
 Argentina
-
 Armenia
-
 Australia
-
 Austria
-
 Azerbaijan
-
 Bahamas
-
 Bahrain
-
 Bangladesh
-
 Belarus
-
 Belgium
-
 Bolivia
-
 Botswana
-
 Brazil
-
 Brunei
-
 Bulgaria
-
 Cambodia
-
 Cameroon
-
 Canada
-
 Chile
Chile
-
 China
China
-
 Colombia
-
 Congo
Congo
-
 Costa Rica
-
 Cote d'Ivoire
-
 Croatia
-
 Cuba
Cuba
-
 Cyprus
-
 Czechia
-
 DR Congo
-
 Denmark
-
 Dominican Republic
-
 Ecuador
-
 Egypt
Egypt
-
 El Salvador
-
 Estonia
-
 Eswatini
-
 Ethiopia
-
 Finland
-
 France
-
 Georgia
-
 Germany
-
 Ghana
Ghana
-
 Greece
-
 Haiti
Haiti
-
 Hong Kong
-
 Hungary
-
 India
India
-
 Indonesia
-
 Iran, Islamic republic
-
 Iraq
Iraq
-
 Ireland
-
 Israel
-
 Italy
Italy
-
 Jamaica
-
 Japan
Japan
-
 Jordan
-
 Kazakhstan
-
 Kenya
Kenya
-
 Korea
Korea
-
 Kuwait
-
 Kyrgyzstan
-
 Laos
Laos
-
 Latvia
-
 Lebanon
-
 Lesotho
-
 Libya
Libya
-
 Lithuania
-
 Luxembourg
-
 Madagascar
-
 Malaysia
-
 Malta
Malta
-
 Mauritius
-
 Mexico
-
 Moldova
-
 Mongolia
-
 Montenegro
-
 Morocco
-
 Mozambique
-
 Myanmar
-
 Namibia
-
 Nepal
Nepal
-
 Netherlands
-
 New Zealand
-
 Nigeria
-
 North Macedonia
-
 Norway
-
 Oman
Oman
-
 Pakistan
-
 Palestine
-
 Panama
-
 Papua New Guinea
-
 Paraguay
-
 Peru
Peru
-
 Philippines
-
 Poland
-
 Portugal
-
 Puerto Rico
-
 Qatar
Qatar
-
 Reunion
-
 Romania
-
 Rwanda
-
 Saudi Arabia
-
 Serbia
-
 Singapore
-
 Slovakia
-
 Slovenia
-
 Somalia
-
 South Africa
-
 Spain
Spain
-
 Sri Lanka
-
 Sweden
-
 Switzerland
-
 Syria
Syria
-
 Taiwan
-
 Tajikistan
-
 Tanzania
-
 Thailand
-
 Trinidad and Tobago
-
 Tunisia
-
 Turkey
-
 UAE
UAE
-
 Uganda
-
 Ukraine
-
 United Kingdom
-
United States
-
 Uruguay
-
 Uzbekistan
-
 Venezuela
-
 Vietnam
-
 Yemen
Yemen
-
 Zambia
-
 Zimbabwe
- Forex
- Crypto
