
Marathon Digital stock: intraday highs and upward bias drive a 4.05% gain

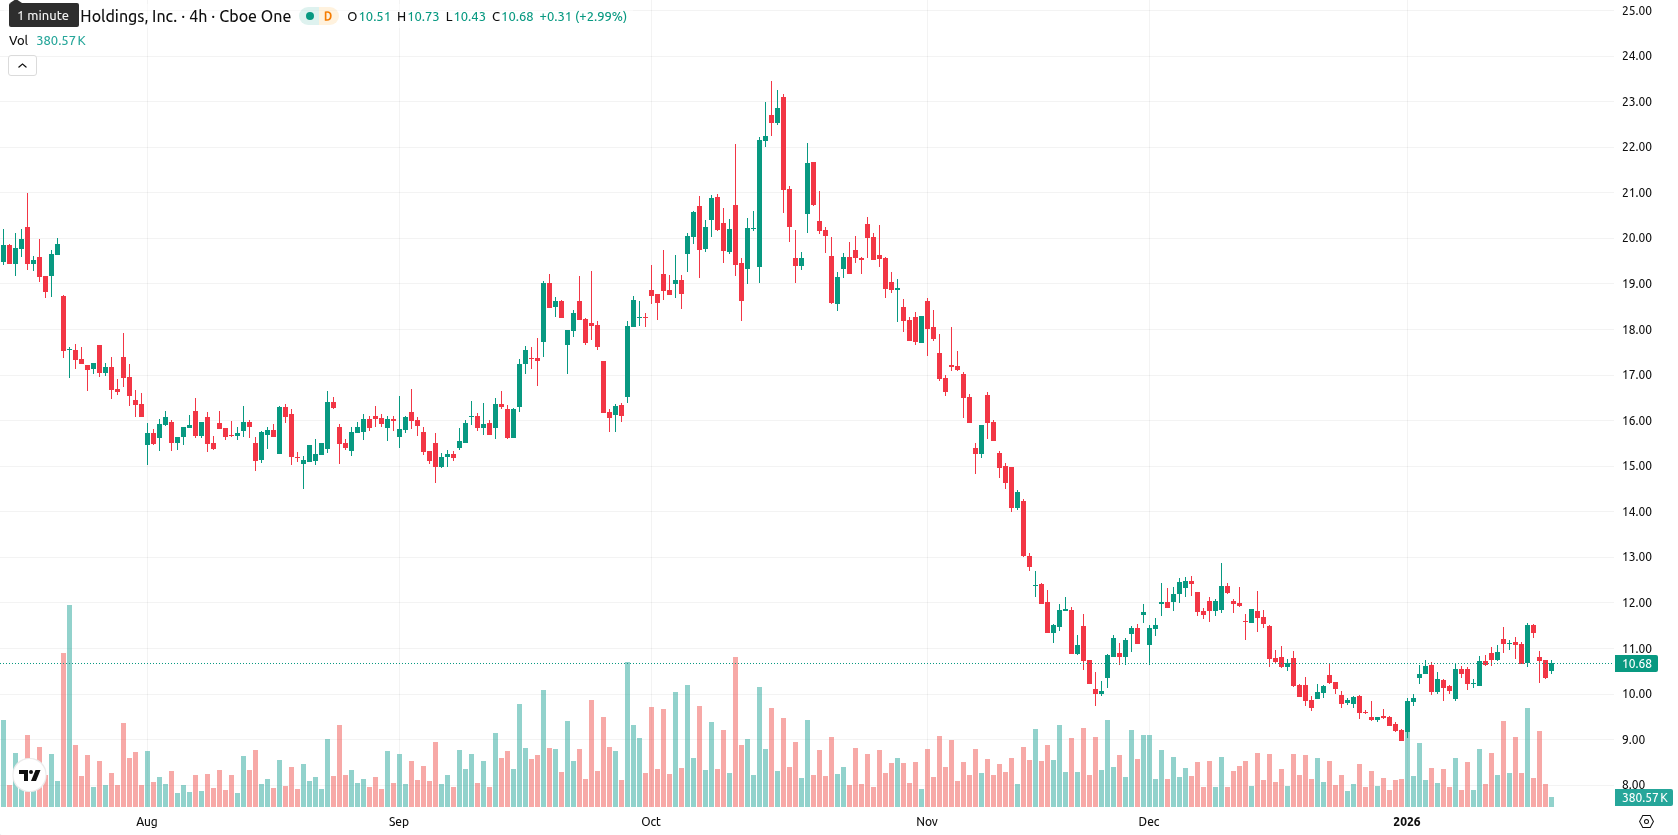
Marathon Digital Holdings, Inc. (MARA, formerly Marathon Patent Group) is trading at $10.79, above both the MA-20 ($10.21) and the Ichimoku Kijun ($10.60), but below the MA-50 ($11.32) and well below the MA-200 ($15.07). This setup suggests some short-term support and mild upward momentum, yet the medium- and long-term trends remain under pressure from sellers, with dynamic resistance now at the MA-50 and $11.00 area.
Highlights
- MARA trades at $10.79, above the MA-20 ($10.21) and Ichimoku Kijun ($10.60) but below key resistance at the MA-50 ($11.32) and MA-200 ($15.07).
- Daily indicators show mixed momentum, with a strong bearish MACD, weak trend on the ADX, and buyers momentarily dominant according to Bull/Bear Power.
- Projected trading range for the coming week is $9.70 to $11.20, with downside favored and less than a 20% probability of a price increase.
Bearish momentum persists as intraday strength diverges from signals
Momentum indicators show mixed signals on the daily timeframe. The MACD points to strong bearish momentum, while the ADX reflects weak trend strength. The RSI is moderately low, and the Stochastic RSI signals strong selling but is not in deep oversold territory. CCI is neutral, indicating a lack of strong overextension. Bull/Bear Power is positive, suggesting buyers are momentarily dominant. There was a modest gap up at today’s open, and the price is currently near the upper end of today’s range, implying strength toward intraday highs amid moderate volatility and a constructive tone so far. However, the Awesome Oscillator is neutral rather than supportive, and the divergence between upward intraday moves and the generally bearish momentum must be noted.
Sideways outlook dominates as bearish bias limits upside scenarios
Looking ahead to the coming week, the likely trading range is $9.70 to $11.20, reflecting MARA’s volatility and the need to keep projections close to the current price. The probability of a price increase is very low (less than 20%), making further declines more likely based on the persistent bearish bias in higher timeframes. The baseline scenario is a sideways move between support at $9.70 and resistance near $11.20. A bullish scenario would require a breakout above the $11.20 area, while a bearish move below $9.70 could invite further downside pressure.
Last time, analysts noted that shares of crypto-focused companies and the broader cryptocurrency market fell sharply following renewed trade-war rhetoric, with Bitcoin slipping below a key support level amid heightened liquidation activity. Previously it was reported that Bitcoin's weakness reflects broader risk-off sentiment rather than crypto fundamentals, with analysts watching the psychological $90,000 support and cautioning that volatility may persist unless safe-haven pressures recede.


-
 Afghanistan
-
 Albania
-
 Algeria
-
 Angola
-
 Argentina
-
 Armenia
-
 Australia
-
 Austria
-
 Azerbaijan
-
 Bahamas
-
 Bahrain
-
 Bangladesh
-
 Belarus
-
 Belgium
-
 Bolivia
-
 Botswana
-
 Brazil
-
 Brunei
-
 Bulgaria
-
 Cambodia
-
 Cameroon
-
 Canada
-
 Chile
Chile
-
 China
China
-
 Colombia
-
 Congo
Congo
-
 Costa Rica
-
 Cote d'Ivoire
-
 Croatia
-
 Cuba
Cuba
-
 Cyprus
-
 Czechia
-
 DR Congo
-
 Denmark
-
 Dominican Republic
-
 Ecuador
-
 Egypt
Egypt
-
 El Salvador
-
 Estonia
-
 Eswatini
-
 Ethiopia
-
 Finland
-
 France
-
 Georgia
-
 Germany
-
 Ghana
Ghana
-
 Greece
-
 Haiti
Haiti
-
 Hong Kong
-
 Hungary
-
 India
India
-
 Indonesia
-
 Iran, Islamic republic
-
 Iraq
Iraq
-
 Ireland
-
 Israel
-
 Italy
Italy
-
 Jamaica
-
 Japan
Japan
-
 Jordan
-
 Kazakhstan
-
 Kenya
Kenya
-
 Korea
Korea
-
 Kuwait
-
 Kyrgyzstan
-
 Laos
Laos
-
 Latvia
-
 Lebanon
-
 Lesotho
-
 Libya
Libya
-
 Lithuania
-
 Luxembourg
-
 Madagascar
-
 Malaysia
-
 Malta
Malta
-
 Mauritius
-
 Mexico
-
 Moldova
-
 Mongolia
-
 Montenegro
-
 Morocco
-
 Mozambique
-
 Myanmar
-
 Namibia
-
 Nepal
Nepal
-
 Netherlands
-
 New Zealand
-
 Nigeria
-
 North Macedonia
-
 Norway
-
 Oman
Oman
-
 Pakistan
-
 Palestine
-
 Panama
-
 Papua New Guinea
-
 Paraguay
-
 Peru
Peru
-
 Philippines
-
 Poland
-
 Portugal
-
 Puerto Rico
-
 Qatar
Qatar
-
 Reunion
-
 Romania
-
 Rwanda
-
 Saudi Arabia
-
 Serbia
-
 Singapore
-
 Slovakia
-
 Slovenia
-
 Somalia
-
 South Africa
-
 Spain
Spain
-
 Sri Lanka
-
 Sweden
-
 Switzerland
-
 Syria
Syria
-
 Taiwan
-
 Tajikistan
-
 Tanzania
-
 Thailand
-
 Trinidad and Tobago
-
 Tunisia
-
 Turkey
-
 UAE
UAE
-
 Uganda
-
 Ukraine
-
 United Kingdom
-
United States
-
 Uruguay
-
 Uzbekistan
-
 Venezuela
-
 Vietnam
-
 Yemen
Yemen
-
 Zambia
-
 Zimbabwe
- Forex
- Crypto
