
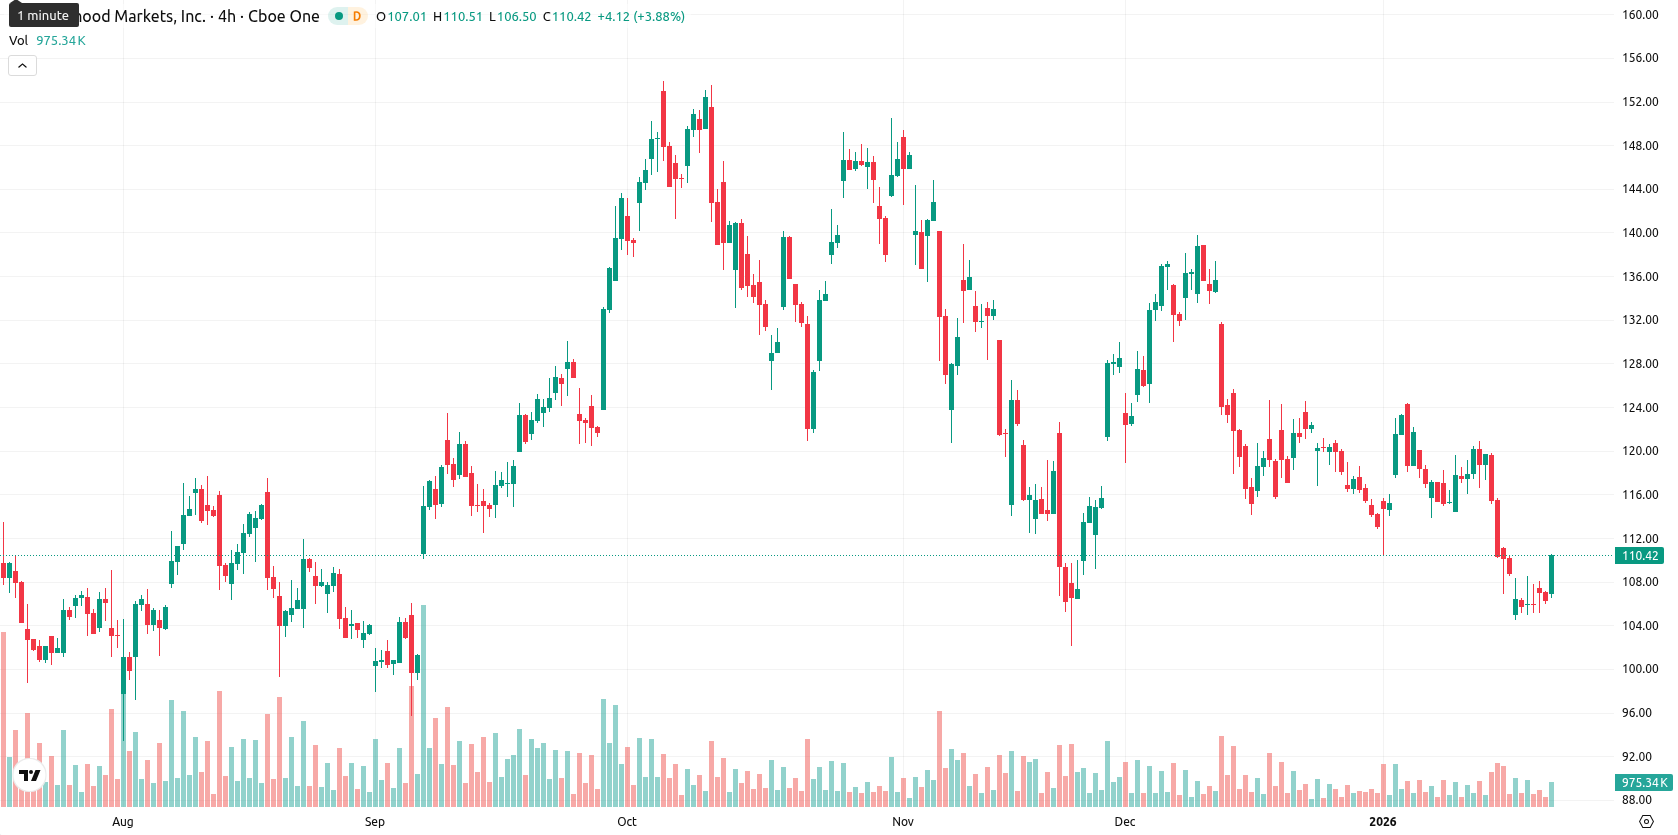
+3.92% for Robinhood stock — daily bounce contrasts with lingering selling pressure

Robinhood Markets Inc (HOOD) is trading at $110.41, putting it below the MA-20 ($115.35) and MA-50 ($120.30), but still above the MA-200 ($102.08). This structure shows ongoing short- and medium-term selling pressure, while long-term support is preserved.
 114.10
119.73
114.10
119.73
Highlights
- HOOD is trading at $110.41, below its MA-20 ($115.35) and MA-50 ($120.30) but above MA-200 ($102.08), indicating short- and medium-term selling pressure with intact long-term support.
- Daily technicals show bearish momentum: MACD signals weakness, RSI is at 36.18, and Stochastic RSI, CCI, Bull/Bear Power, and Awesome Oscillator all indicate an oversold, seller-dominated environment.
- Projected five-day trading range is $109.40 to $112.15 with less than 20% probability of upward breakout; nearest resistance is $114.58 (Ichimoku Kijun), and key support is $102.08 (MA-200).
New offerings and global expansion drive post-S&P 500 momentum
Robinhood reported strong growth after its inclusion in the S&P 500, supported by its first year of profitability. The company broadened its offerings with new products including Cortex (AI assistant), Legend (trading toolkit), and Robinhood Social, designed to attract advanced users, and also expanded into personal finance products such as a Gold credit card and partnered with Sage Home Loans. Robinhood’s international growth was strengthened by tokenized U.S. stocks/ETF launches and expansion into the U.K., while it also became a leader in prediction markets with 9 billion contracts as of January 22, 2026.
Bearish daily momentum contrasts with intraday strength near resistance
Momentum signals for HOOD are mixed: the daily MACD indicates weakness, the ADX D1 is neutral, and D1 RSI lies at a bearish 36.18, while Stochastic RSI, CCI, and Bull/Bear Power all show oversold conditions and clear seller dominance. The Awesome Oscillator also implies bearish daily tone. Despite a small gap up and 3.92% recent gains, HOOD sits near the session high in the $106.52 – $110.40 range, but this intraday strength contrasts with ongoing bearish momentum seen on daily charts.
Limited rebound odds as daily signals favor further downside
Over the next five trading days, the typical volatility band is projected between $109.40 and $112.15. The odds of a sustained rebound are low (less than 20%), with daily indicators favoring a further decline even as weekly momentum attempts a bounce. The base case envisions sideways consolidation near $110, with any breakout targeting the $114 – $115 area, and a bearish move likely to retest support in the $108 – $109 region.





Latest Robinhood News









-
 Afghanistan
-
 Albania
-
 Algeria
-
 Angola
-
 Argentina
-
 Armenia
-
 Australia
-
 Austria
-
 Azerbaijan
-
 Bahamas
-
 Bahrain
-
 Bangladesh
-
 Belarus
-
 Belgium
-
 Bolivia
-
 Botswana
-
 Brazil
-
 Brunei
-
 Bulgaria
-
 Cambodia
-
 Cameroon
-
 Canada
-
 Chile
Chile
-
 China
China
-
 Colombia
-
 Congo
Congo
-
 Costa Rica
-
 Cote d'Ivoire
-
 Croatia
-
 Cuba
Cuba
-
 Cyprus
-
 Czechia
-
 DR Congo
-
 Denmark
-
 Dominican Republic
-
 Ecuador
-
 Egypt
Egypt
-
 El Salvador
-
 Estonia
-
 Eswatini
-
 Ethiopia
-
 Finland
-
 France
-
 Georgia
-
 Germany
-
 Ghana
Ghana
-
 Greece
-
 Haiti
Haiti
-
 Hong Kong
-
 Hungary
-
 India
India
-
 Indonesia
-
 Iran, Islamic republic
-
 Iraq
Iraq
-
 Ireland
-
 Israel
-
 Italy
Italy
-
 Jamaica
-
 Japan
Japan
-
 Jordan
-
 Kazakhstan
-
 Kenya
Kenya
-
 Korea
Korea
-
 Kuwait
-
 Kyrgyzstan
-
 Laos
Laos
-
 Latvia
-
 Lebanon
-
 Lesotho
-
 Libya
Libya
-
 Lithuania
-
 Luxembourg
-
 Madagascar
-
 Malaysia
-
 Malta
Malta
-
 Mauritius
-
 Mexico
-
 Moldova
-
 Mongolia
-
 Montenegro
-
 Morocco
-
 Mozambique
-
 Myanmar
-
 Namibia
-
 Nepal
Nepal
-
 Netherlands
-
 New Zealand
-
 Nigeria
-
 North Macedonia
-
 Norway
-
 Oman
Oman
-
 Pakistan
-
 Palestine
-
 Panama
-
 Papua New Guinea
-
 Paraguay
-
 Peru
Peru
-
 Philippines
-
 Poland
-
 Portugal
-
 Puerto Rico
-
 Qatar
Qatar
-
 Reunion
-
 Romania
-
 Rwanda
-
 Saudi Arabia
-
 Serbia
-
 Singapore
-
 Slovakia
-
 Slovenia
-
 Somalia
-
 South Africa
-
 Spain
Spain
-
 Sri Lanka
-
 Sweden
-
 Switzerland
-
 Syria
Syria
-
 Taiwan
-
 Tajikistan
-
 Tanzania
-
 Thailand
-
 Trinidad and Tobago
-
 Tunisia
-
 Turkey
-
 UAE
UAE
-
 Uganda
-
 Ukraine
-
 United Kingdom
-
United States
-
 Uruguay
-
 Uzbekistan
-
 Venezuela
-
 Vietnam
-
 Yemen
Yemen
-
 Zambia
-
 Zimbabwe
- Forex
- Crypto











