
Tesla stock price forecast: Bearish momentum limits rally as TSLA falls below key moving averages

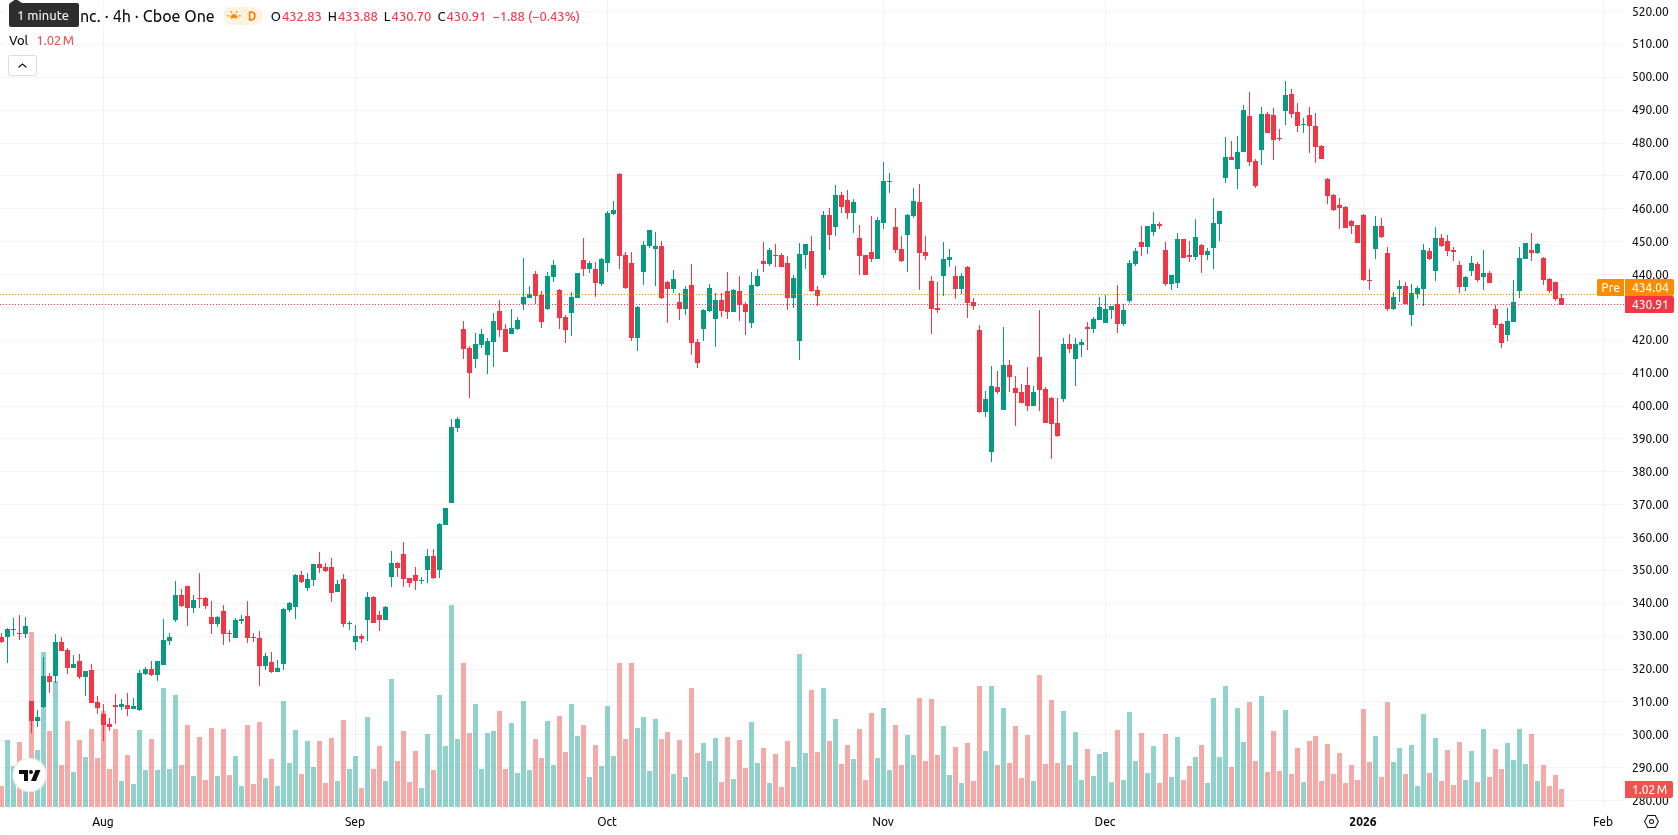
Tesla, Inc. (TSLA) is trading at $430.82, which is below the MA-20 ($441.27) and MA-50 ($442.29), but remains above the MA-200 ($374.60). This setup suggests clear short- to medium-term bearish pressure, while keeping longer-term structure supported.
Highlights
- Tesla trades at $430.82, below its MA-20 ($441.27) and MA-50 ($442.29), reflecting short- to medium-term bearish momentum.
- Bearish signals are confirmed by MACD Sell, ADX weak trend, RSI at 44.10, and Commodity Channel Index at -83.14, indicating seller dominance.
- Immediate trading range is $417.00–$445.00; a close below $417.00 risks decline toward MA-200 support at $374.60, while resistance stands at $458.14.
Investor focus sharpens amid product transition and executive departure
Tesla is set to release its fourth-quarter 2025 earnings report after the close on January 28, 2026. The company recently transitioned its Full Self-Driving business model to subscriptions only, and another director-level executive has departed ahead of the earnings event. Investors are watching for updates on Robotaxi development, capital expenditure guidance, and key business segment performance.
Bearish momentum persists as resistance holds and oscillators weaken
For technicals, Tesla remains capped beneath the MA-20 and MA-50, with the Ichimoku Kijun resistance at $458.14 and dynamic downside support near the MA-200 at $374.60. Momentum signals tilt bearish: the daily MACD issues a Sell, ADX shows weak trend strength, both RSI (44.10) and Commodity Channel Index (-83.14) suggest Sell, and Bull/Bear Power is firmly Oversold. Stochastic RSI is Neutral at 47.47, indicating no clear oversold conditions, while price action stays bearish with moderate volatility and synchronized negative momentum across most oscillators.
Downside risk prevails as most indicators flag further weakness
Over the next five trading days, Tesla is likely to remain in a typical volatility band between $417.00 and $445.00 relative to current levels. The probability of a further decline is higher, given only one out of four weekly momentum and trend indicators signal Buy. The base case sees Tesla moving sideways within this range, while a break above $445.00 could target resistance at $458.14. A daily close below $417.00 risks a slide to long-term support at the MA-200 near $374.60.
Previously it was reported that Tesla's stock remains volatile near recent highs, with sellers defending resistance as the company approaches its Q4 2025 earnings release amidst weaker earnings expectations and ongoing valuation concerns. Technical indicators suggest price action is consolidating, with momentum signals mixed and key support levels being closely watched for any signs of further downside.


-
 Afghanistan
-
 Albania
-
 Algeria
-
 Angola
-
 Argentina
-
 Armenia
-
 Australia
-
 Austria
-
 Azerbaijan
-
 Bahamas
-
 Bahrain
-
 Bangladesh
-
 Belarus
-
 Belgium
-
 Bolivia
-
 Botswana
-
 Brazil
-
 Brunei
-
 Bulgaria
-
 Cambodia
-
 Cameroon
-
 Canada
-
 Chile
Chile
-
 China
China
-
 Colombia
-
 Congo
Congo
-
 Costa Rica
-
 Cote d'Ivoire
-
 Croatia
-
 Cuba
Cuba
-
 Cyprus
-
 Czechia
-
 DR Congo
-
 Denmark
-
 Dominican Republic
-
 Ecuador
-
 Egypt
Egypt
-
 El Salvador
-
 Estonia
-
 Eswatini
-
 Ethiopia
-
 Finland
-
 France
-
 Georgia
-
 Germany
-
 Ghana
Ghana
-
 Greece
-
 Haiti
Haiti
-
 Hong Kong
-
 Hungary
-
 India
India
-
 Indonesia
-
 Iran, Islamic republic
-
 Iraq
Iraq
-
 Ireland
-
 Israel
-
 Italy
Italy
-
 Jamaica
-
 Japan
Japan
-
 Jordan
-
 Kazakhstan
-
 Kenya
Kenya
-
 Korea
Korea
-
 Kuwait
-
 Kyrgyzstan
-
 Laos
Laos
-
 Latvia
-
 Lebanon
-
 Lesotho
-
 Libya
Libya
-
 Lithuania
-
 Luxembourg
-
 Madagascar
-
 Malaysia
-
 Malta
Malta
-
 Mauritius
-
 Mexico
-
 Moldova
-
 Mongolia
-
 Montenegro
-
 Morocco
-
 Mozambique
-
 Myanmar
-
 Namibia
-
 Nepal
Nepal
-
 Netherlands
-
 New Zealand
-
 Nigeria
-
 North Macedonia
-
 Norway
-
 Oman
Oman
-
 Pakistan
-
 Palestine
-
 Panama
-
 Papua New Guinea
-
 Paraguay
-
 Peru
Peru
-
 Philippines
-
 Poland
-
 Portugal
-
 Puerto Rico
-
 Qatar
Qatar
-
 Reunion
-
 Romania
-
 Rwanda
-
 Saudi Arabia
-
 Serbia
-
 Singapore
-
 Slovakia
-
 Slovenia
-
 Somalia
-
 South Africa
-
 Spain
Spain
-
 Sri Lanka
-
 Sweden
-
 Switzerland
-
 Syria
Syria
-
 Taiwan
-
 Tajikistan
-
 Tanzania
-
 Thailand
-
 Trinidad and Tobago
-
 Tunisia
-
 Turkey
-
 UAE
UAE
-
 Uganda
-
 Ukraine
-
 United Kingdom
-
United States
-
 Uruguay
-
 Uzbekistan
-
 Venezuela
-
 Vietnam
-
 Yemen
Yemen
-
 Zambia
-
 Zimbabwe
- Forex
- Crypto
