
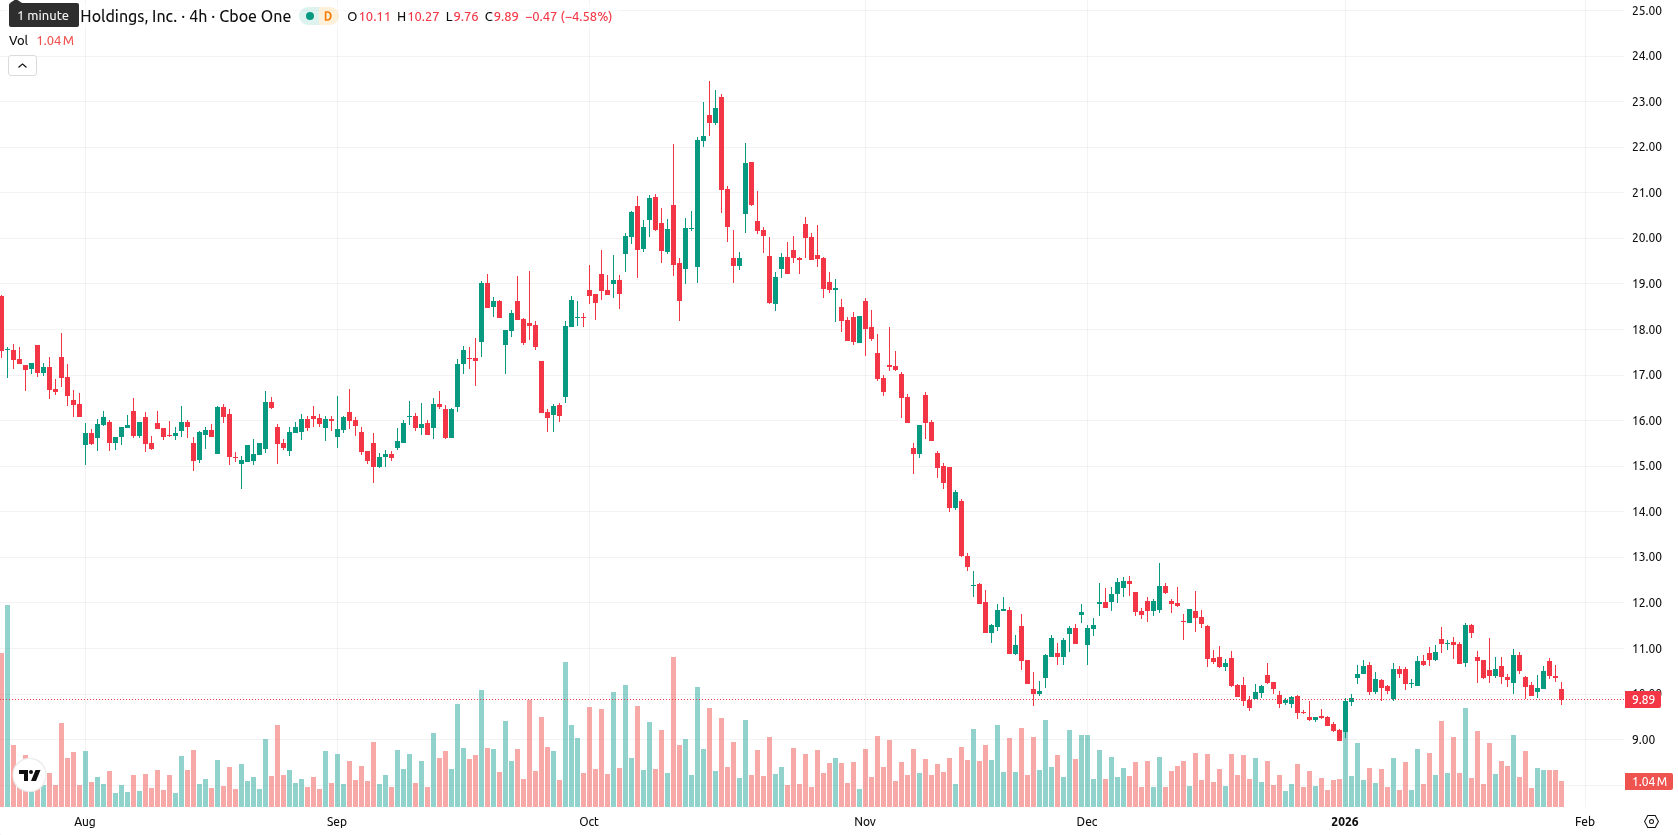
-4.53% for Marathon Digital stock — momentum stays weak as support nears $9.70

Marathon Digital Holdings, Inc. (MARA) is trading at $9.90, below the MA-20 ($10.36), MA-50 ($10.78), and MA-200 ($15.04), highlighting persistent selling pressure across short-, medium-, and long-term timeframes. The asset opened with a minor gap down from $10.37 to $10.10 and now trades near today’s low, reflecting a 4.53% drop and moderate intraday volatility.
Highlights
- MARA trades at $9.90, below its MA-20 ($10.36), MA-50 ($10.78), and MA-200 ($15.04), indicating broad-based selling pressure across timeframes.
- Momentum is decisively negative with MACD showing strong sell, ADX a weak trend, and RSI/Stochastic RSI trending downward but not yet oversold.
- Expected five-day range is $9.70–$10.20; resistance stands at $10.26 while a break below $9.70 could trigger further declines.
Downward momentum builds as resistance caps weak buyer attempts
The nearest dynamic resistance is at the Ichimoku Kijun level of $10.26, with support forming close to recent lows. Momentum indicators present a negative bias, as the MACD signals strong sell and ADX reflects a weak trend. RSI (47.26) and Stochastic RSI (33.78) are both pointing downward, indicating possible emerging oversold conditions, while CCI is neutral. Bull/Bear Power stands positive at 0.31 on the daily chart, marking modest buyer attempts, but the Awesome Oscillator confirms overall bearish momentum.
Further downside likely as bearish technicals limit rebound chances
For the next five trading days, the expected trading range for MARA is $9.70 to $10.20, forming a typical volatility band relative to current levels. There is a very low probability (less than 20%) of a sharp price rebound, while further declines remain likely, as weekly RSI, MACD, and the Moving Averages all support a bearish view. The baseline scenario calls for price consolidation in a narrow corridor with short-term support forming. A bullish move would require a clear break and sustained hold above $10.26 resistance, while a bearish break below $9.70 could trigger further selling to new short-term lows.
Last time, analysts noted that Marathon Digital Holdings Inc. remains under sustained bearish pressure, with the price trading below all key moving averages and encountering resistance at the Ichimoku Kijun level. Daily momentum signals, including negative MACD, sell-biased RSI and Stoch RSI, and dominating sell-side intraday momentum, reinforce the prevailing negative technical outlook.


-
 Afghanistan
-
 Albania
-
 Algeria
-
 Angola
-
 Argentina
-
 Armenia
-
 Australia
-
 Austria
-
 Azerbaijan
-
 Bahamas
-
 Bahrain
-
 Bangladesh
-
 Belarus
-
 Belgium
-
 Bolivia
-
 Botswana
-
 Brazil
-
 Brunei
-
 Bulgaria
-
 Cambodia
-
 Cameroon
-
 Canada
-
 Chile
Chile
-
 China
China
-
 Colombia
-
 Congo
Congo
-
 Costa Rica
-
 Cote d'Ivoire
-
 Croatia
-
 Cuba
Cuba
-
 Cyprus
-
 Czechia
-
 DR Congo
-
 Denmark
-
 Dominican Republic
-
 Ecuador
-
 Egypt
Egypt
-
 El Salvador
-
 Estonia
-
 Eswatini
-
 Ethiopia
-
 Finland
-
 France
-
 Georgia
-
 Germany
-
 Ghana
Ghana
-
 Greece
-
 Haiti
Haiti
-
 Hong Kong
-
 Hungary
-
 India
India
-
 Indonesia
-
 Iran, Islamic republic
-
 Iraq
Iraq
-
 Ireland
-
 Israel
-
 Italy
Italy
-
 Jamaica
-
 Japan
Japan
-
 Jordan
-
 Kazakhstan
-
 Kenya
Kenya
-
 Korea
Korea
-
 Kuwait
-
 Kyrgyzstan
-
 Laos
Laos
-
 Latvia
-
 Lebanon
-
 Lesotho
-
 Libya
Libya
-
 Lithuania
-
 Luxembourg
-
 Madagascar
-
 Malaysia
-
 Malta
Malta
-
 Mauritius
-
 Mexico
-
 Moldova
-
 Mongolia
-
 Montenegro
-
 Morocco
-
 Mozambique
-
 Myanmar
-
 Namibia
-
 Nepal
Nepal
-
 Netherlands
-
 New Zealand
-
 Nigeria
-
 North Macedonia
-
 Norway
-
 Oman
Oman
-
 Pakistan
-
 Palestine
-
 Panama
-
 Papua New Guinea
-
 Paraguay
-
 Peru
Peru
-
 Philippines
-
 Poland
-
 Portugal
-
 Puerto Rico
-
 Qatar
Qatar
-
 Reunion
-
 Romania
-
 Rwanda
-
 Saudi Arabia
-
 Serbia
-
 Singapore
-
 Slovakia
-
 Slovenia
-
 Somalia
-
 South Africa
-
 Spain
Spain
-
 Sri Lanka
-
 Sweden
-
 Switzerland
-
 Syria
Syria
-
 Taiwan
-
 Tajikistan
-
 Tanzania
-
 Thailand
-
 Trinidad and Tobago
-
 Tunisia
-
 Turkey
-
 UAE
UAE
-
 Uganda
-
 Ukraine
-
 United Kingdom
-
United States
-
 Uruguay
-
 Uzbekistan
-
 Venezuela
-
 Vietnam
-
 Yemen
Yemen
-
 Zambia
-
 Zimbabwe
- Forex
- Crypto
