
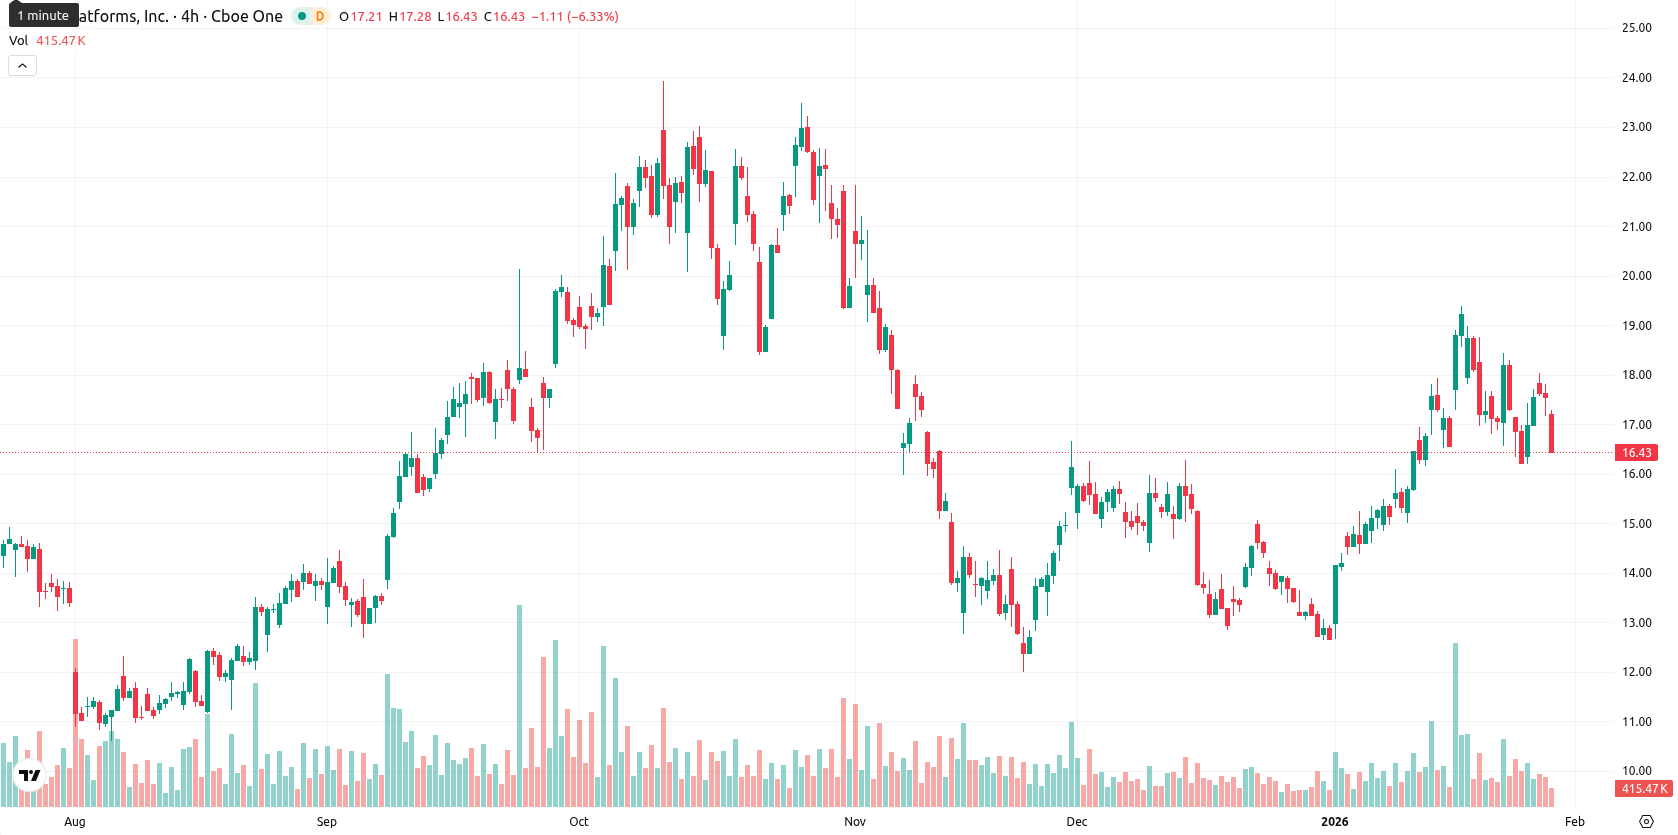
-6.89% for Riot Platforms stock — mixed momentum amid strong quarterly results

Riot Platforms, Inc. (RIOT, formerly Riot Blockchain) is trading at $16.34 after a daily move from a $17.55 close to a $17.22 open, representing a loss of 6.89%. The price has settled above its short-, medium-, and long-term moving averages (MA-20 at $16.12, MA-50 at $15.06, MA-200 at $13.74), signaling a prevailing bullish trend, though high intraday volatility has been observed.
Highlights
- Broad Peak Investment Advisers acquired 1.41 million Riot Platforms shares worth $17.86 million, as disclosed in a January 29 SEC filing.
- Riot Platforms ended the quarter with over $330 million in unrestricted cash, 19,300 bitcoin held, and quarterly revenue of $180 million, supporting capital deployment for mining operations.
- RIOT trades at $16.34, above key moving averages with strong bullish technicals, but faces immediate volatility; expected weekly range is $16.00–$16.95, with over 80% probability of price increase.
Capital inflows and robust balance sheet bolster mining expansion
Riot Platforms reported that Broad Peak Investment Advisers acquired 1.41 million shares of the company, valued at about $17.86 million according to an SEC filing dated January 29. The company closed the quarter with more than $330 million in unrestricted cash and held approximately 19,300 bitcoin on its balance sheet. Riot also noted its strong quarterly revenue of $180 million and highlighted capital deployment for its large-scale Bitcoin mining and institutional power solutions.
Supportive momentum diverges from price amid mixed indicators
Momentum for RIOT remains constructive as MACD is on a Buy signal and ADX indicates a neutral-to-moderate trend, although mixed signals arise from short-term oscillators. The RSI and CCI indicate mild upward momentum, with Stochastic RSI appearing neutral on the daily chart but oversold on intraday timeframes, hinting at a potential near-term bounce. Bull/Bear Power reflects an overbought condition and buyer dominance on the daily chart. The nearest dynamic support is the Ichimoku Kijun at $15.99, with notable resistance at the recent high and the MA-20. Despite today's intraday weakness and volatility, overall momentum remains supportive, suggesting a divergence between price action and indicator signals.
Upside bias expected as consolidation aligns with technical strength
Over the next five trading days, RIOT is projected to consolidate within a weekly range of $16.00 to $16.95, forming a volatility band relative to current levels. There is a high probability of price appreciation, bolstered by bullish signals from multiple weekly timeframe indicators, while downside risk is limited. The baseline view expects the price to oscillate between $16.00 and $16.95. Should RIOT break above $16.95, a move to the next resistance is possible; a drop below $16.00 would expose dynamic support at the Ichimoku Kijun, currently $15.99.
Previously it was reported that Riot Platforms Inc. is demonstrating bullish momentum, trading above major moving averages and key technical indicators such as the Ichimoku Kijun, with dynamic support established near these levels. Momentum signals remain mixed as the MACD issues a buy signal but oscillators like the RSI and Awesome Oscillator show neutral conditions, while sustained buying pressure and moderate volatility favor short-term upside within a consolidation range.


-
 Afghanistan
-
 Albania
-
 Algeria
-
 Angola
-
 Argentina
-
 Armenia
-
 Australia
-
 Austria
-
 Azerbaijan
-
 Bahamas
-
 Bahrain
-
 Bangladesh
-
 Belarus
-
 Belgium
-
 Bolivia
-
 Botswana
-
 Brazil
-
 Brunei
-
 Bulgaria
-
 Cambodia
-
 Cameroon
-
 Canada
-
 Chile
Chile
-
 China
China
-
 Colombia
-
 Congo
Congo
-
 Costa Rica
-
 Cote d'Ivoire
-
 Croatia
-
 Cuba
Cuba
-
 Cyprus
-
 Czechia
-
 DR Congo
-
 Denmark
-
 Dominican Republic
-
 Ecuador
-
 Egypt
Egypt
-
 El Salvador
-
 Estonia
-
 Eswatini
-
 Ethiopia
-
 Finland
-
 France
-
 Georgia
-
 Germany
-
 Ghana
Ghana
-
 Greece
-
 Haiti
Haiti
-
 Hong Kong
-
 Hungary
-
 India
India
-
 Indonesia
-
 Iran, Islamic republic
-
 Iraq
Iraq
-
 Ireland
-
 Israel
-
 Italy
Italy
-
 Jamaica
-
 Japan
Japan
-
 Jordan
-
 Kazakhstan
-
 Kenya
Kenya
-
 Korea
Korea
-
 Kuwait
-
 Kyrgyzstan
-
 Laos
Laos
-
 Latvia
-
 Lebanon
-
 Lesotho
-
 Libya
Libya
-
 Lithuania
-
 Luxembourg
-
 Madagascar
-
 Malaysia
-
 Malta
Malta
-
 Mauritius
-
 Mexico
-
 Moldova
-
 Mongolia
-
 Montenegro
-
 Morocco
-
 Mozambique
-
 Myanmar
-
 Namibia
-
 Nepal
Nepal
-
 Netherlands
-
 New Zealand
-
 Nigeria
-
 North Macedonia
-
 Norway
-
 Oman
Oman
-
 Pakistan
-
 Palestine
-
 Panama
-
 Papua New Guinea
-
 Paraguay
-
 Peru
Peru
-
 Philippines
-
 Poland
-
 Portugal
-
 Puerto Rico
-
 Qatar
Qatar
-
 Reunion
-
 Romania
-
 Rwanda
-
 Saudi Arabia
-
 Serbia
-
 Singapore
-
 Slovakia
-
 Slovenia
-
 Somalia
-
 South Africa
-
 Spain
Spain
-
 Sri Lanka
-
 Sweden
-
 Switzerland
-
 Syria
Syria
-
 Taiwan
-
 Tajikistan
-
 Tanzania
-
 Thailand
-
 Trinidad and Tobago
-
 Tunisia
-
 Turkey
-
 UAE
UAE
-
 Uganda
-
 Ukraine
-
 United Kingdom
-
United States
-
 Uruguay
-
 Uzbekistan
-
 Venezuela
-
 Vietnam
-
 Yemen
Yemen
-
 Zambia
-
 Zimbabwe
- Forex
- Crypto
