
Q4 earnings miss but revenue surprise — JetBlue Airways stock gains 5.79%

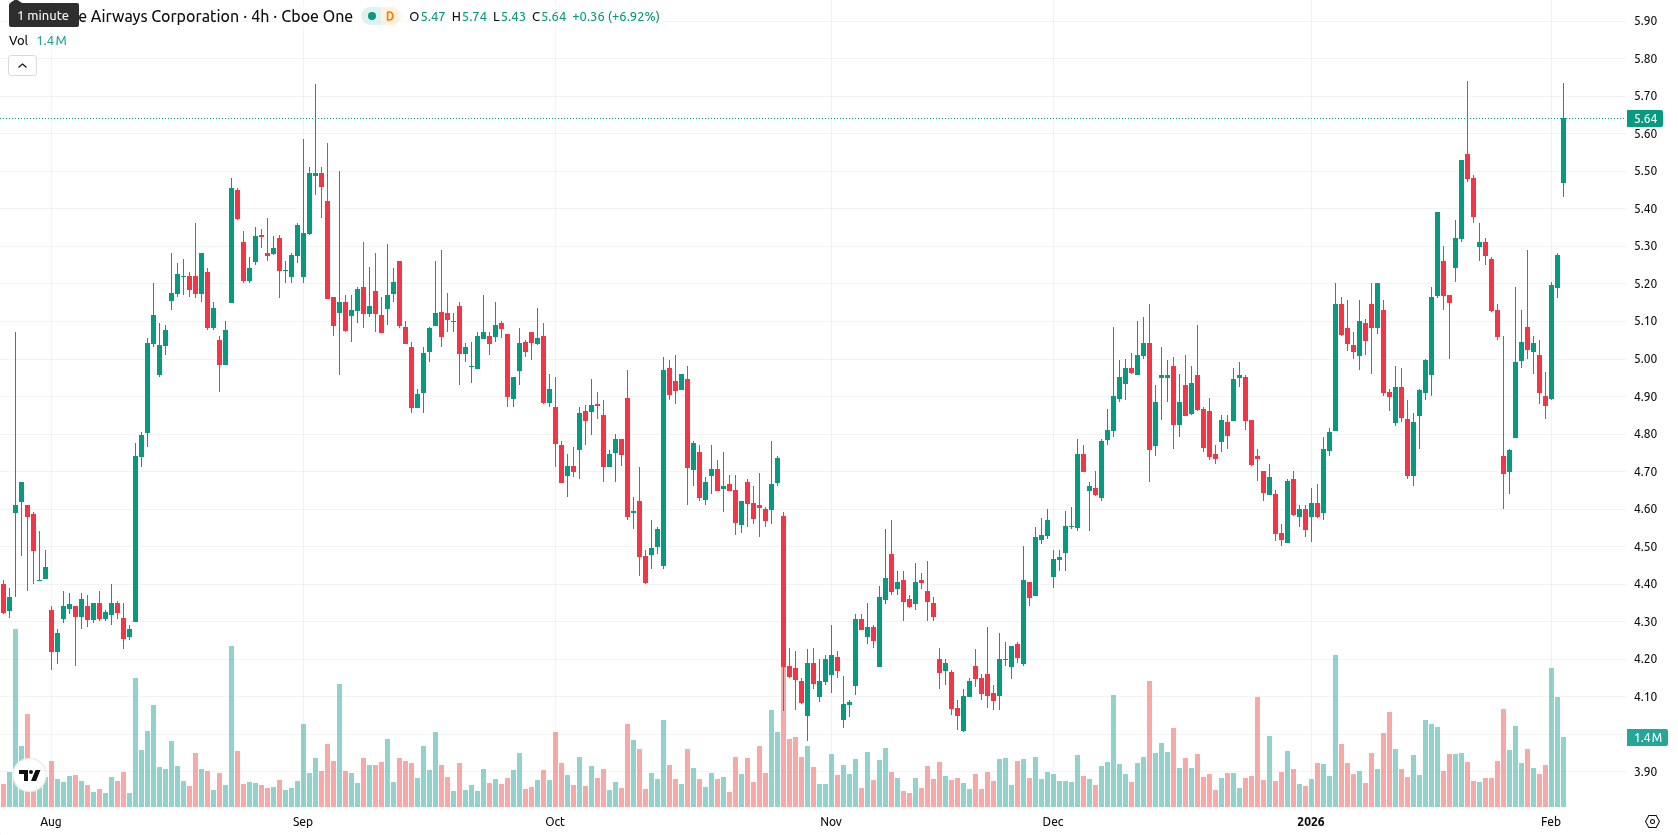
JetBlue Airways Corp (JBLU) is trading at $5.58, which is well above the MA-20 at $5.07, MA-50 at $4.82, and MA-200 at $4.69, indicating established bullish momentum across short, medium, and long-term trends. The session saw a robust daily advance of 5.79%, opened with a small gap up from $5.27 to $5.45, and is currently near the top of its intraday range of $5.45 – $5.74, reflecting strong upward pressure and elevated volatility.
Highlights
- JetBlue Airways missed Q4 2025 earnings expectations with an EPS of -$0.49, but modestly beat revenue estimates at $2.24 billion.
- 2026 guidance forecasts a 0.5% to 3.5% decline in Q1 Available Seat Miles and up to a 5% decrease in full-year RASM.
- JetBlue shares trade at $5.58, above key MAs (MA-20: $5.07, MA-50: $4.82, MA-200: $4.69), with high probability (>80%) of further price increases toward $6.00.
Earnings shortfall offset by revenue beat and strategic partnerships
JetBlue Airways reported its fourth-quarter 2025 results, missing earnings expectations with an EPS of -$0.49 but modestly surpassing revenue estimates at $2.24 billion. The company outlined 2026 guidance that includes a projected 0.5% to 3.5% decline in first-quarter Available Seat Miles and up to a 5% decrease in full-year RASM. Additional initiatives included a new interline booking agreement with Contour Airlines and the launch of day passes for the BlueHouse lounge at JFK airport.
Continuation signals as price holds above support amid strong momentum
From a technical perspective, JBLU is trading firmly above key moving averages — with the closest dynamic support at the Ichimoku Kijun level of $5.13 and the next key resistance at the round $6.00 mark. Momentum signals remain positive: the daily MACD shows a strong buy, the ADX is neutral on trend strength, RSI is at 55.98 in buy territory, and the Stochastic RSI at 53.07 signals strong buy, while CCI is neutral. Although some short-term overbought signals are present, Bull/Bear Power and the Awesome Oscillator confirm buyers dominate intraday momentum, supporting the ongoing bullish tone.
Sideways range likely as upward bias persists with limited downside risk
In the short term, JBLU is expected to trade within a typical volatility band of $5.55 to $6.05 over the next five sessions, consistent with recent technical behavior and volatility. There is a very high probability (greater than 80%) of further price increases as three out of four major weekly indicators show a buy. The primary scenario is for continued sideways consolidation between $5.55 and $6.05, with a bullish breakout possible above $6.00. A sharp turn lower may develop only if JBLU closes below the dynamic support at $5.13, which could expose further downside toward $5.00.
Previously it was reported that JetBlue Airways is exhibiting a bullish trend, trading above key moving averages with strong MACD buy signals and positive momentum, though overbought readings from RSI and Stoch RSI indicate potential for short-term pullbacks. Immediate dynamic support is seen at $5.13, while resistance lies just above current levels, as elevated volatility and sustained buying interest drive prices toward session highs.


Latest JetBlue News


-
 Afghanistan
-
 Albania
-
 Algeria
-
 Angola
-
 Argentina
-
 Armenia
-
 Australia
-
 Austria
-
 Azerbaijan
-
 Bahamas
-
 Bahrain
-
 Bangladesh
-
 Belarus
-
 Belgium
-
 Bolivia
-
 Botswana
-
 Brazil
-
 Brunei
-
 Bulgaria
-
 Cambodia
-
 Cameroon
-
 Canada
-
 Chile
Chile
-
 China
China
-
 Colombia
-
 Congo
Congo
-
 Costa Rica
-
 Cote d'Ivoire
-
 Croatia
-
 Cuba
Cuba
-
 Cyprus
-
 Czechia
-
 DR Congo
-
 Denmark
-
 Dominican Republic
-
 Ecuador
-
 Egypt
Egypt
-
 El Salvador
-
 Estonia
-
 Eswatini
-
 Ethiopia
-
 Finland
-
 France
-
 Georgia
-
 Germany
-
 Ghana
Ghana
-
 Greece
-
 Haiti
Haiti
-
 Hong Kong
-
 Hungary
-
 India
India
-
 Indonesia
-
 Iran, Islamic republic
-
 Iraq
Iraq
-
 Ireland
-
 Israel
-
 Italy
Italy
-
 Jamaica
-
 Japan
Japan
-
 Jordan
-
 Kazakhstan
-
 Kenya
Kenya
-
 Korea
Korea
-
 Kuwait
-
 Kyrgyzstan
-
 Laos
Laos
-
 Latvia
-
 Lebanon
-
 Lesotho
-
 Libya
Libya
-
 Lithuania
-
 Luxembourg
-
 Madagascar
-
 Malaysia
-
 Malta
Malta
-
 Mauritius
-
 Mexico
-
 Moldova
-
 Mongolia
-
 Montenegro
-
 Morocco
-
 Mozambique
-
 Myanmar
-
 Namibia
-
 Nepal
Nepal
-
 Netherlands
-
 New Zealand
-
 Nigeria
-
 North Macedonia
-
 Norway
-
 Oman
Oman
-
 Pakistan
-
 Palestine
-
 Panama
-
 Papua New Guinea
-
 Paraguay
-
 Peru
Peru
-
 Philippines
-
 Poland
-
 Portugal
-
 Puerto Rico
-
 Qatar
Qatar
-
 Reunion
-
 Romania
-
 Rwanda
-
 Saudi Arabia
-
 Serbia
-
 Singapore
-
 Slovakia
-
 Slovenia
-
 Somalia
-
 South Africa
-
 Spain
Spain
-
 Sri Lanka
-
 Sweden
-
 Switzerland
-
 Syria
Syria
-
 Taiwan
-
 Tajikistan
-
 Tanzania
-
 Thailand
-
 Trinidad and Tobago
-
 Tunisia
-
 Turkey
-
 UAE
UAE
-
 Uganda
-
 Ukraine
-
 United Kingdom
-
United States
-
 Uruguay
-
 Uzbekistan
-
 Venezuela
-
 Vietnam
-
 Yemen
Yemen
-
 Zambia
-
 Zimbabwe
- Forex
- Crypto
