
-3.13% for Intel stock — overbought signals and elevated selling pressure reinforce pullback

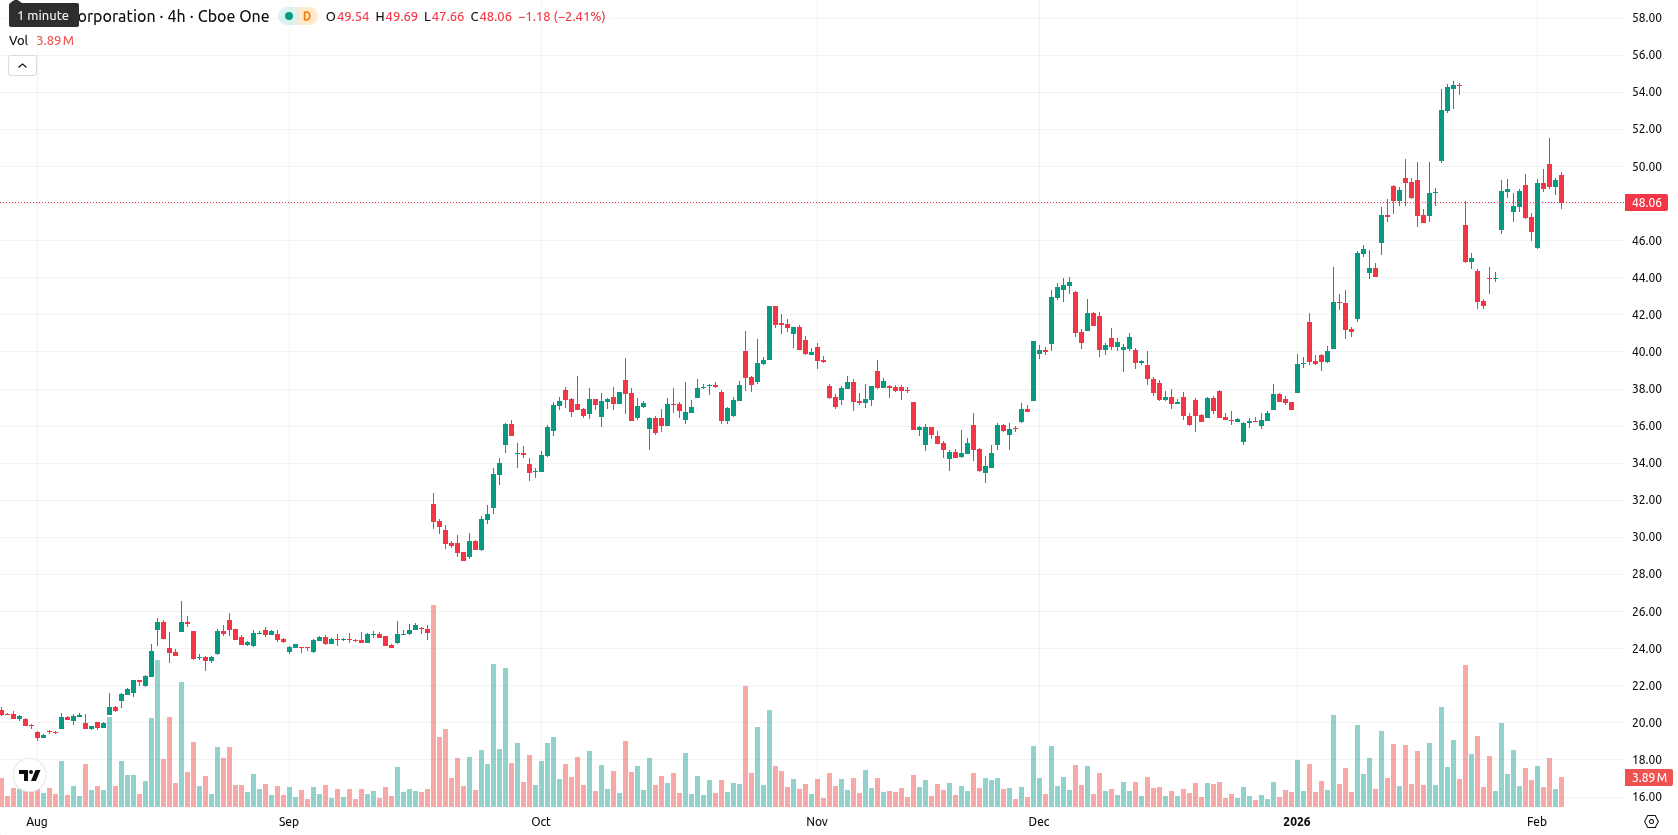
Intel Corporation (INTC) is trading at $47.73, above both the MA-20 ($46.77) and MA-50 ($41.59), and well above the MA-200 ($30.11), confirming a bullish structure across short, medium, and long-term timeframes. The price is currently near the low end of today's range after slipping 3.13% from the previous session, signaling heightened intraday volatility and profit-taking pressure following a recent rally.
Highlights
- Intel and SoftBank's Saimemory subsidiary announced a strategic partnership to develop next-generation 'Z-Angle Memory' for AI and HPC, targeting prototypes by fiscal 2027 and commercialization by fiscal 2029.
- Eric Demmers, formerly of Qualcomm, has been appointed chief architect to lead Intel's GPU research and development strategy.
- Intel trades at $47.73, above MA-20 ($46.77), MA-50 ($41.59), and MA-200 ($30.11), with key resistance at $50.00 and support at $45.21, reflecting strong bullish momentum across longer timeframes.
Strategic partnership and leadership shift fuel innovation outlook
Intel has announced a strategic partnership with SoftBank's Saimemory subsidiary to develop next-generation 'Z-Angle Memory' for artificial intelligence and high-performance computing, aiming for prototype development by fiscal 2027 and commercialization by fiscal 2029. This collaboration focuses on creating memory solutions with higher capacity, increased bandwidth, and reduced power consumption compared to current technologies. Additionally, Intel appointed Eric Demmers, formerly of Qualcomm, as chief architect to lead its GPU research and development strategy.
Bullish momentum moderates as resistance and overbought signals emerge
Technical analysis shows Intel trading above its key moving averages, with the nearest dynamic support at the Ichimoku Kijun of $45.21 and resistance at the MA-50 or the $50 round level. Momentum indicators remain mostly bullish: MACD and ADX signal strong upside, while the Stochastic RSI is neutral and CCI suggests only moderate upward bias. The daily Bull/Bear Power shows overbought conditions, indicating recent buyer dominance, but multiple short-term timeframes are registering oversold and the RSI stands at 58, signaling buying interest without being overbought. The Awesome Oscillator aligns with the bullish trend, though daily action indicates some pullback and increased volatility.
Consolidation favored as bullish break risks short-term reversal
Over the next five trading days, Intel is likely to consolidate within a typical volatility band of $46.00 – $50.00. There is a very high probability (over 80%) of continued price strength, given the consistently bullish weekly momentum signals. The main scenario is sideways movement in the $46.00 – $50.00 range, with a bullish breakout above $50.00 targeting $51.50 – $52.00. A bearish reversal below $46.00 would put $45.20 (Ichimoku Kijun) into focus as key support.
Previously it was reported that Intel Corporation is exhibiting a strong bullish structure across all major timeframes, with the share price trending well above key moving averages and momentum indicators such as MACD and ADX confirming the prevailing uptrend. The price has consolidated after a recent gap up, with RSI and Stochastic RSI supporting further strength, while the near-term outlook anticipates continued consolidation within a $49.00 to $53.50 range and a high probability of a bullish breakout if upward momentum persists.


-
 Afghanistan
-
 Albania
-
 Algeria
-
 Angola
-
 Argentina
-
 Armenia
-
 Australia
-
 Austria
-
 Azerbaijan
-
 Bahamas
-
 Bahrain
-
 Bangladesh
-
 Belarus
-
 Belgium
-
 Bolivia
-
 Botswana
-
 Brazil
-
 Brunei
-
 Bulgaria
-
 Cambodia
-
 Cameroon
-
 Canada
-
 Chile
Chile
-
 China
China
-
 Colombia
-
 Congo
Congo
-
 Costa Rica
-
 Cote d'Ivoire
-
 Croatia
-
 Cuba
Cuba
-
 Cyprus
-
 Czechia
-
 DR Congo
-
 Denmark
-
 Dominican Republic
-
 Ecuador
-
 Egypt
Egypt
-
 El Salvador
-
 Estonia
-
 Eswatini
-
 Ethiopia
-
 Finland
-
 France
-
 Georgia
-
 Germany
-
 Ghana
Ghana
-
 Greece
-
 Haiti
Haiti
-
 Hong Kong
-
 Hungary
-
 India
India
-
 Indonesia
-
 Iran, Islamic republic
-
 Iraq
Iraq
-
 Ireland
-
 Israel
-
 Italy
Italy
-
 Jamaica
-
 Japan
Japan
-
 Jordan
-
 Kazakhstan
-
 Kenya
Kenya
-
 Korea
Korea
-
 Kuwait
-
 Kyrgyzstan
-
 Laos
Laos
-
 Latvia
-
 Lebanon
-
 Lesotho
-
 Libya
Libya
-
 Lithuania
-
 Luxembourg
-
 Madagascar
-
 Malaysia
-
 Malta
Malta
-
 Mauritius
-
 Mexico
-
 Moldova
-
 Mongolia
-
 Montenegro
-
 Morocco
-
 Mozambique
-
 Myanmar
-
 Namibia
-
 Nepal
Nepal
-
 Netherlands
-
 New Zealand
-
 Nigeria
-
 North Macedonia
-
 Norway
-
 Oman
Oman
-
 Pakistan
-
 Palestine
-
 Panama
-
 Papua New Guinea
-
 Paraguay
-
 Peru
Peru
-
 Philippines
-
 Poland
-
 Portugal
-
 Puerto Rico
-
 Qatar
Qatar
-
 Reunion
-
 Romania
-
 Rwanda
-
 Saudi Arabia
-
 Serbia
-
 Singapore
-
 Slovakia
-
 Slovenia
-
 Somalia
-
 South Africa
-
 Spain
Spain
-
 Sri Lanka
-
 Sweden
-
 Switzerland
-
 Syria
Syria
-
 Taiwan
-
 Tajikistan
-
 Tanzania
-
 Thailand
-
 Trinidad and Tobago
-
 Tunisia
-
 Turkey
-
 UAE
UAE
-
 Uganda
-
 Ukraine
-
 United Kingdom
-
United States
-
 Uruguay
-
 Uzbekistan
-
 Venezuela
-
 Vietnam
-
 Yemen
Yemen
-
 Zambia
-
 Zimbabwe
- Forex
- Crypto
