

Interactive Brokers stock: Technical levels and investment inflows drive a sharp 5.6% rise

Interactive Brokers Group, Inc. (IBKR) is trading at $73.38, just below the MA-20 ($73.62), comfortably above the MA-50 ($68.70), and well above the MA-200 ($62.20). This configuration signals some short-term resistance but confirms a medium- to long-term bullish structure.
IBKR price prediction
Current price:
$81.79
0.4450
0.55%
Closed
11/13
Daily range
80.60
 82.02
82.02
Weekly range
76.56
83.71
83.71
Loading...
Highlights
- Hartford Investment Management Co. initiated a new position in Interactive Brokers during Q3, acquiring 26,127 shares as per the latest SEC Form 13F filing.
- No other corporate actions or noteworthy fundamental developments were reported for Interactive Brokers during this period.
- IBKR trades at $73.38, just below its MA-20 ($73.62) with key support at $71.52 and high probability (>80%) of price holding above $71.00 over the next five sessions.
Institutional stake acquisition as Hartford Investment Management shifts holdings
Hartford Investment Management Co. acquired a new stake in Interactive Brokers during the third quarter, purchasing 26,127 shares as disclosed in a recent SEC Form 13F filing. This move marks a change in institutional ownership. No other corporate actions were highlighted during this period.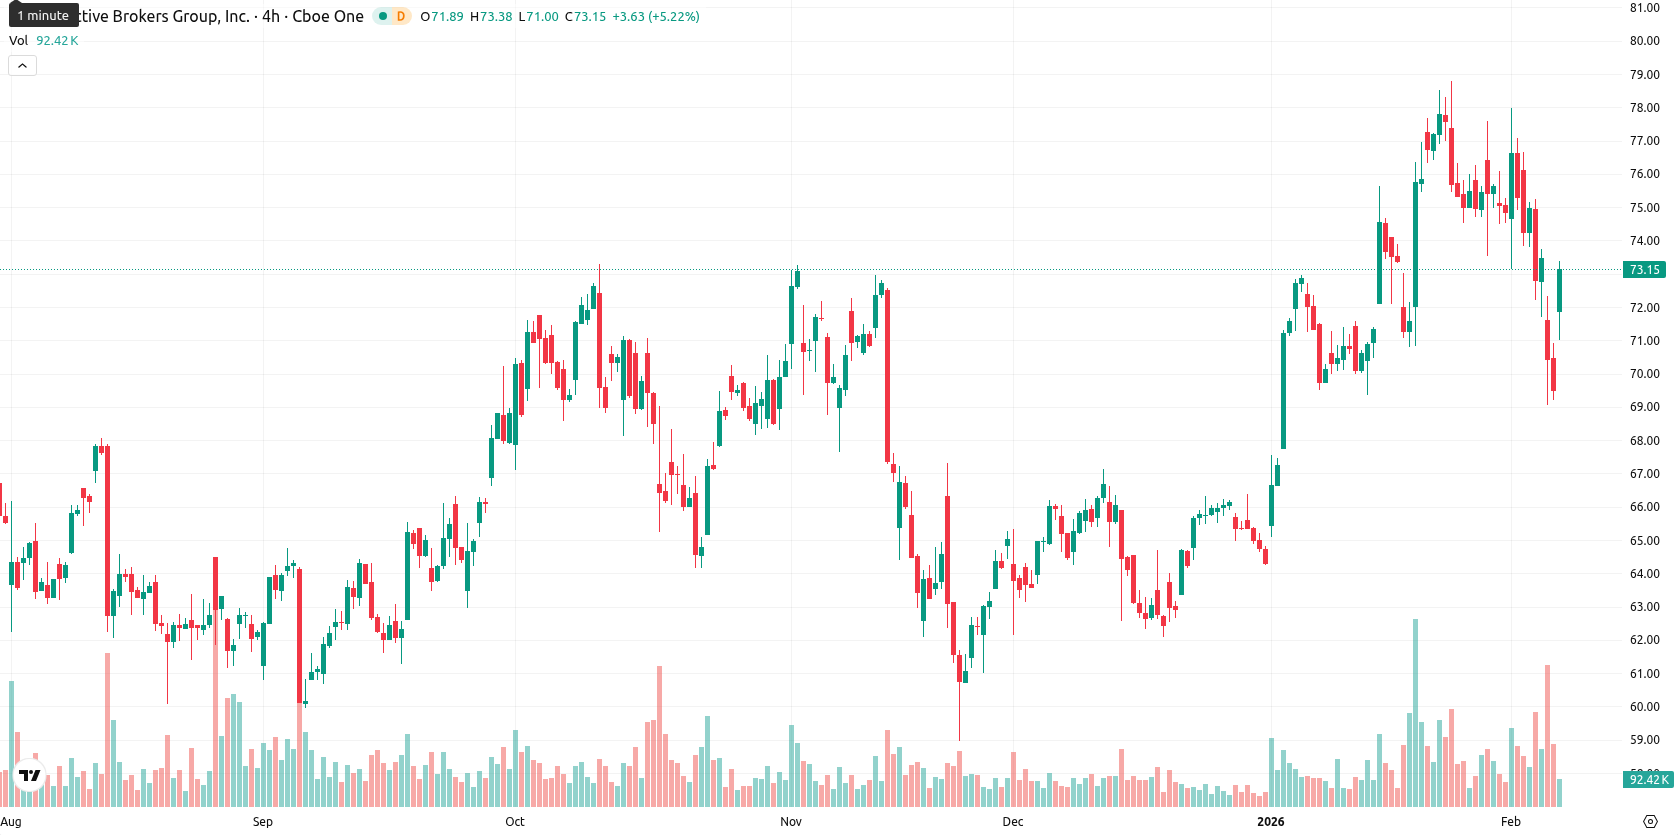
Mixed momentum and seller pressure as volatility tests technical levels
IBKR's nearest key support is at the Ichimoku Kijun ($71.52), with immediate resistance likely at the MA-20 and MA-50 levels. Momentum signals are mixed: daily MACD points to a strong upward impulse, the ADX shows a developing trend, but the RSI (41.35) and Commodity Channel Index (-106.28) indicate short-term oversold conditions. Bull/Bear Power is deeply negative, underscoring recent seller dominance despite a sharp rebound today. A clear upward gap at the open and trading near today's high reflect high intraday volatility and persistent upward pressure, with divergence suggesting potential choppy action as the market digests the move.High breakout probability with consolidation risk above Ichimoku support
Over the next five sessions, IBKR is expected to trade within a typical volatility band of $71.00 – $76.50. The probability of further price increases is very high (more than 80%), while a decrease is less likely. The baseline scenario is for sideways consolidation above the Ichimoku Kijun, with a bullish outcome seeing a breakout above $76.50. A bearish reversal scenario could unfold if the price retreats below $71.00, potentially triggering additional selling.
Viktoras Karapetjanc, analyst at Traders Union, sees Interactive Brokers as maintaining a bullish structure above key moving averages. He notes institutional buy-in from Hartford Investment Management, which is a fundamental vote of confidence. The expert believes mixed short-term momentum will likely resolve with sideways price action, unless strong support or resistance levels break. Macro and sentiment trends suggest resilient upward pressure dominates for now. "With institutional flows turning positive and technical momentum holding, I expect IBKR to challenge higher levels if $71.00 support holds."
Previously it was reported that Interactive Brokers has enhanced its Client Portal with mobile optimization and expanded watchlist functionality centered on Investment Themes, aligning with the increasing trend toward on-the-go portfolio management and theme-driven trading strategies. These updates are expected to improve workflow efficiency and user engagement, supported by flexible platform access and streamlined monitoring tools, as traders seek advanced features and broad global market access.
Source of Data:
IBKR Price Analysis by TU
The analysis is based on a proprietary model combining technical, on-chain, and expert data. Not investment advice. See
methodology
The information is based on forecasts and does not constitute investment advice or a guarantee of future results. Market conditions may change. See our Disclaimer and Editorial Integrity for details.
Subscribe to TU news


Did you like the article?




Latest Interactive Brokers News

Top News


Top 5 companies for you

United States
-
 Afghanistan
-
 Albania
-
 Algeria
-
 Angola
-
 Argentina
-
 Armenia
-
 Australia
-
 Austria
-
 Azerbaijan
-
 Bahamas
-
 Bahrain
-
 Bangladesh
-
 Belarus
-
 Belgium
-
 Bolivia
-
 Botswana
-
 Brazil
-
 Brunei
-
 Bulgaria
-
 Cambodia
-
 Cameroon
-
 Canada
-
 Chile
-
 China
-
 Colombia
-
 Congo
-
 Costa Rica
-
 Cote d'Ivoire
-
 Croatia
-
 Cuba
-
 Cyprus
-
 Czechia
-
 DR Congo
-
 Denmark
-
 Dominican Republic
-
 Ecuador
-
 Egypt
-
 El Salvador
-
 Estonia
-
 Eswatini
-
 Ethiopia
-
 Finland
-
 France
-
 Georgia
-
 Germany
-
 Ghana
-
 Greece
-
 Haiti
-
 Hong Kong
-
 Hungary
-
 India
-
 Indonesia
-
 Iran, Islamic republic
-
 Iraq
-
 Ireland
-
 Israel
-
 Italy
-
 Jamaica
-
 Japan
-
 Jordan
-
 Kazakhstan
-
 Kenya
-
 Korea
-
 Kuwait
-
 Kyrgyzstan
-
 Laos
-
 Latvia
-
 Lebanon
-
 Lesotho
-
 Libya
-
 Lithuania
-
 Luxembourg
-
 Madagascar
-
 Malaysia
-
 Malta
-
 Mauritius
-
 Mexico
-
 Moldova
-
 Mongolia
-
 Montenegro
-
 Morocco
-
 Mozambique
-
 Myanmar
-
 Namibia
-
 Nepal
-
 Netherlands
-
 New Zealand
-
 Nigeria
-
 North Macedonia
-
 Norway
-
 Oman
-
 Pakistan
-
 Palestine
-
 Panama
-
 Papua New Guinea
-
 Paraguay
-
 Peru
-
 Philippines
-
 Poland
-
 Portugal
-
 Puerto Rico
-
 Qatar
-
 Reunion
-
 Romania
-
 Rwanda
-
 Saudi Arabia
-
 Serbia
-
 Singapore
-
 Slovakia
-
 Slovenia
-
 Somalia
-
 South Africa
-
 Spain
-
 Sri Lanka
-
 Sweden
-
 Switzerland
-
 Syria
-
 Taiwan
-
 Tajikistan
-
 Tanzania
-
 Thailand
-
 Trinidad and Tobago
-
 Tunisia
-
 Turkey
-
 UAE
-
 Uganda
-
 Ukraine
-
 United Kingdom
-
United States
-
 Uruguay
-
 Uzbekistan
-
 Venezuela
-
 Vietnam
-
 Yemen
-
 Zambia
-
 Zimbabwe
- Forex
- Crypto










Live News


