
Apple drops 1.65% with bullish momentum moderating despite positive RSI and Ichimoku Kijun line support – weekly analysis

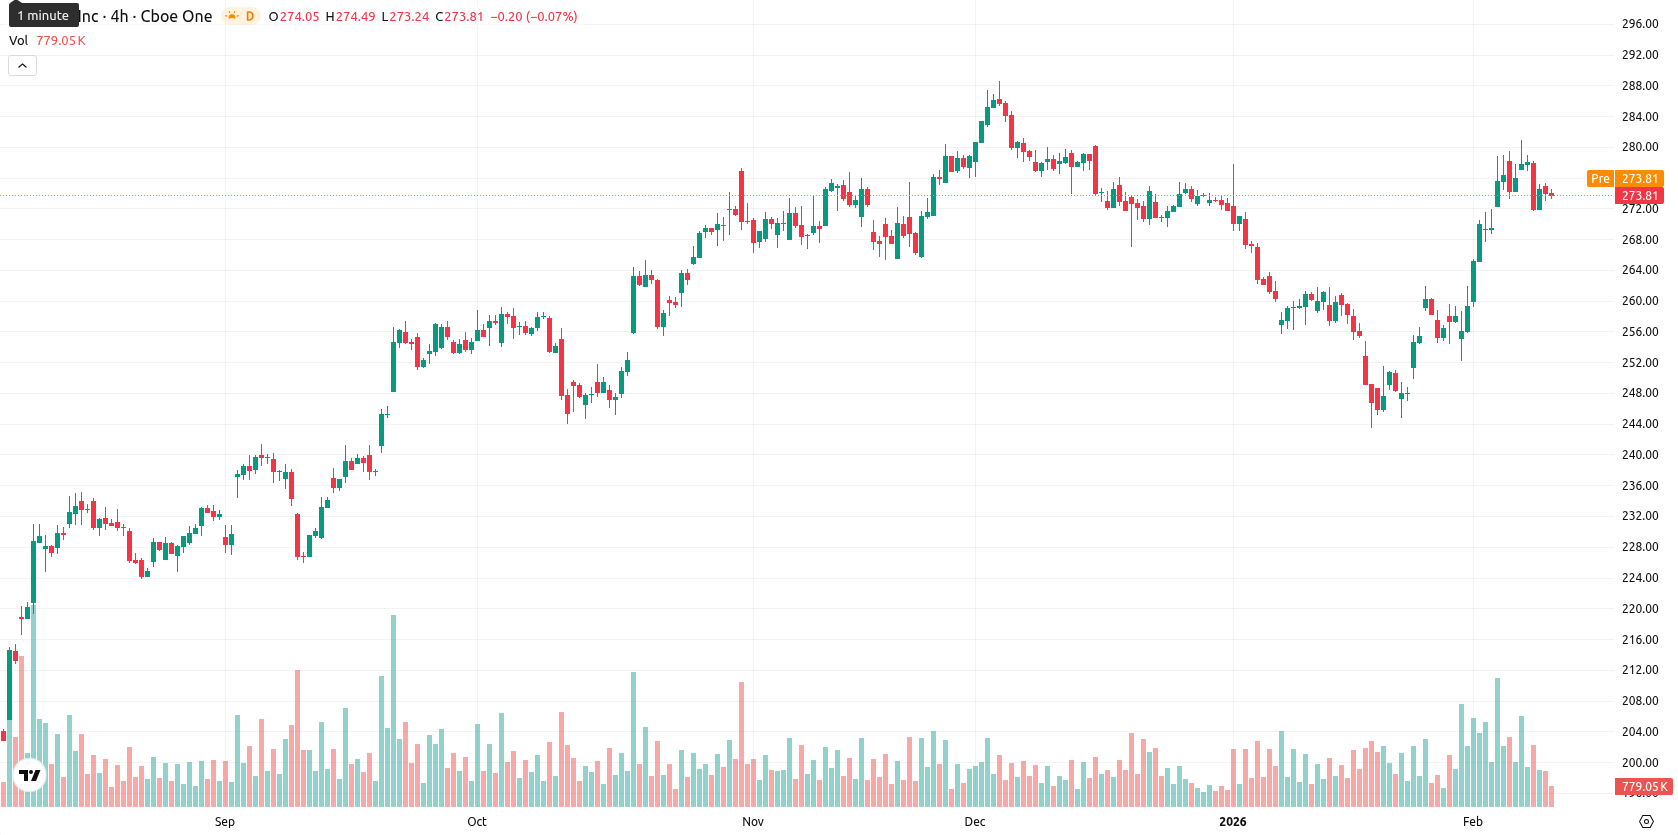
Apple Inc. (AAPL) closed the week at $273.84, gaining ground both absolutely and as a percentage, as the price advanced strongly over the last seven days. The asset remains well above its weekly MA-20 at $261.61, MA-50 at $268.58, and MA-200 at $239.24, underscoring persistent bullish momentum on the weekly timeframe.
Highlights
- Apple (AAPL) is trading at $273.84, above its MA-20 ($261.61), MA-50 ($268.58), and MA-200 ($239.24), confirming bullish short- and long-term trends.
- Momentum indicators including MACD (buy signal), RSI, and CCI indicate continued buying interest, but overbought oscillators and intraday weakness suggest short-term exhaustion risk.
- Price is expected to consolidate between $270.00 and $278.00 over the next five trading days, with an 80%+ probability of further upside unless a break below $270 signals a bearish pullback.
Dividend declaration and AI push drive positive sentiment this week
Apple has declared a cash dividend of $0.26 per share, payable on February 12 to shareholders of record as of February 9. The company continues to emphasize AI development, including a partnership with Google for Gemini AI foundation models to enhance its AI portfolio. Additionally, recent iPhone demand has shown a strong recovery, following a prior period of weaker sales.
Momentum wanes as technical indicators flag overbought signals over the week
On the weekly chart, AAPL is holding firm above all major moving averages — the MA-20, MA-50, and MA-200 — which act as dynamic support levels, with the Kijun line from the Ichimoku system at $262.15 offering additional foundation. Key resistance is observed at the MA-50 ($268.58) and the round number near $275. RSI readings on the W1 timeframe indicate ongoing buying interest, while other momentum indicators signal moderate bullish sentiment yet highlight a potentially overbought condition, suggesting that upward momentum may be losing steam in the short to medium term.
Rangebound trade likely as overbought risks temper bullish outlook next week
Looking ahead to the next five to seven trading days, AAPL is likely to consolidate within the $270.00 to $278.00 range, reflecting typical weekly volatility while adhering to the established bullish structure. The probability for further price gains remains high, supported by strong weekly indicator signals, though a corrective pullback cannot be ruled out if overbought pressures persist. A sustained breakout above $278 could trigger a new bullish extension, while a drop below $270 may signal the start of a downward correction toward dynamic support levels.
Last time, analysts noted that Apple Inc. maintained a stable position above its 20-day, 50-day, and 200-day moving averages, with MACD signaling ongoing bullish momentum while some oscillators flagged overbought conditions. Despite short-term caution around overbought readings, the stock continued to consolidate near key support at $262 and faced resistance at $275, keeping the probability of further upside elevated.


-
 Afghanistan
-
 Albania
-
 Algeria
-
 Angola
-
 Argentina
-
 Armenia
-
 Australia
-
 Austria
-
 Azerbaijan
-
 Bahamas
-
 Bahrain
-
 Bangladesh
-
 Belarus
-
 Belgium
-
 Bolivia
-
 Botswana
-
 Brazil
-
 Brunei
-
 Bulgaria
-
 Cambodia
-
 Cameroon
-
 Canada
-
 Chile
Chile
-
 China
China
-
 Colombia
-
 Congo
Congo
-
 Costa Rica
-
 Cote d'Ivoire
-
 Croatia
-
 Cuba
Cuba
-
 Cyprus
-
 Czechia
-
 DR Congo
-
 Denmark
-
 Dominican Republic
-
 Ecuador
-
 Egypt
Egypt
-
 El Salvador
-
 Estonia
-
 Eswatini
-
 Ethiopia
-
 Finland
-
 France
-
 Georgia
-
 Germany
-
 Ghana
Ghana
-
 Greece
-
 Haiti
Haiti
-
 Hong Kong
-
 Hungary
-
 India
India
-
 Indonesia
-
 Iran, Islamic republic
-
 Iraq
Iraq
-
 Ireland
-
 Israel
-
 Italy
Italy
-
 Jamaica
-
 Japan
Japan
-
 Jordan
-
 Kazakhstan
-
 Kenya
Kenya
-
 Korea
Korea
-
 Kuwait
-
 Kyrgyzstan
-
 Laos
Laos
-
 Latvia
-
 Lebanon
-
 Lesotho
-
 Libya
Libya
-
 Lithuania
-
 Luxembourg
-
 Madagascar
-
 Malaysia
-
 Malta
Malta
-
 Mauritius
-
 Mexico
-
 Moldova
-
 Mongolia
-
 Montenegro
-
 Morocco
-
 Mozambique
-
 Myanmar
-
 Namibia
-
 Nepal
Nepal
-
 Netherlands
-
 New Zealand
-
 Nigeria
-
 North Macedonia
-
 Norway
-
 Oman
Oman
-
 Pakistan
-
 Palestine
-
 Panama
-
 Papua New Guinea
-
 Paraguay
-
 Peru
Peru
-
 Philippines
-
 Poland
-
 Portugal
-
 Puerto Rico
-
 Qatar
Qatar
-
 Reunion
-
 Romania
-
 Rwanda
-
 Saudi Arabia
-
 Serbia
-
 Singapore
-
 Slovakia
-
 Slovenia
-
 Somalia
-
 South Africa
-
 Spain
Spain
-
 Sri Lanka
-
 Sweden
-
 Switzerland
-
 Syria
Syria
-
 Taiwan
-
 Tajikistan
-
 Tanzania
-
 Thailand
-
 Trinidad and Tobago
-
 Tunisia
-
 Turkey
-
 UAE
UAE
-
 Uganda
-
 Ukraine
-
 United Kingdom
-
United States
-
 Uruguay
-
 Uzbekistan
-
 Venezuela
-
 Vietnam
-
 Yemen
Yemen
-
 Zambia
-
 Zimbabwe
- Forex
- Crypto
