
Bit Digital stock declines as bearish trend accelerates below key moving averages

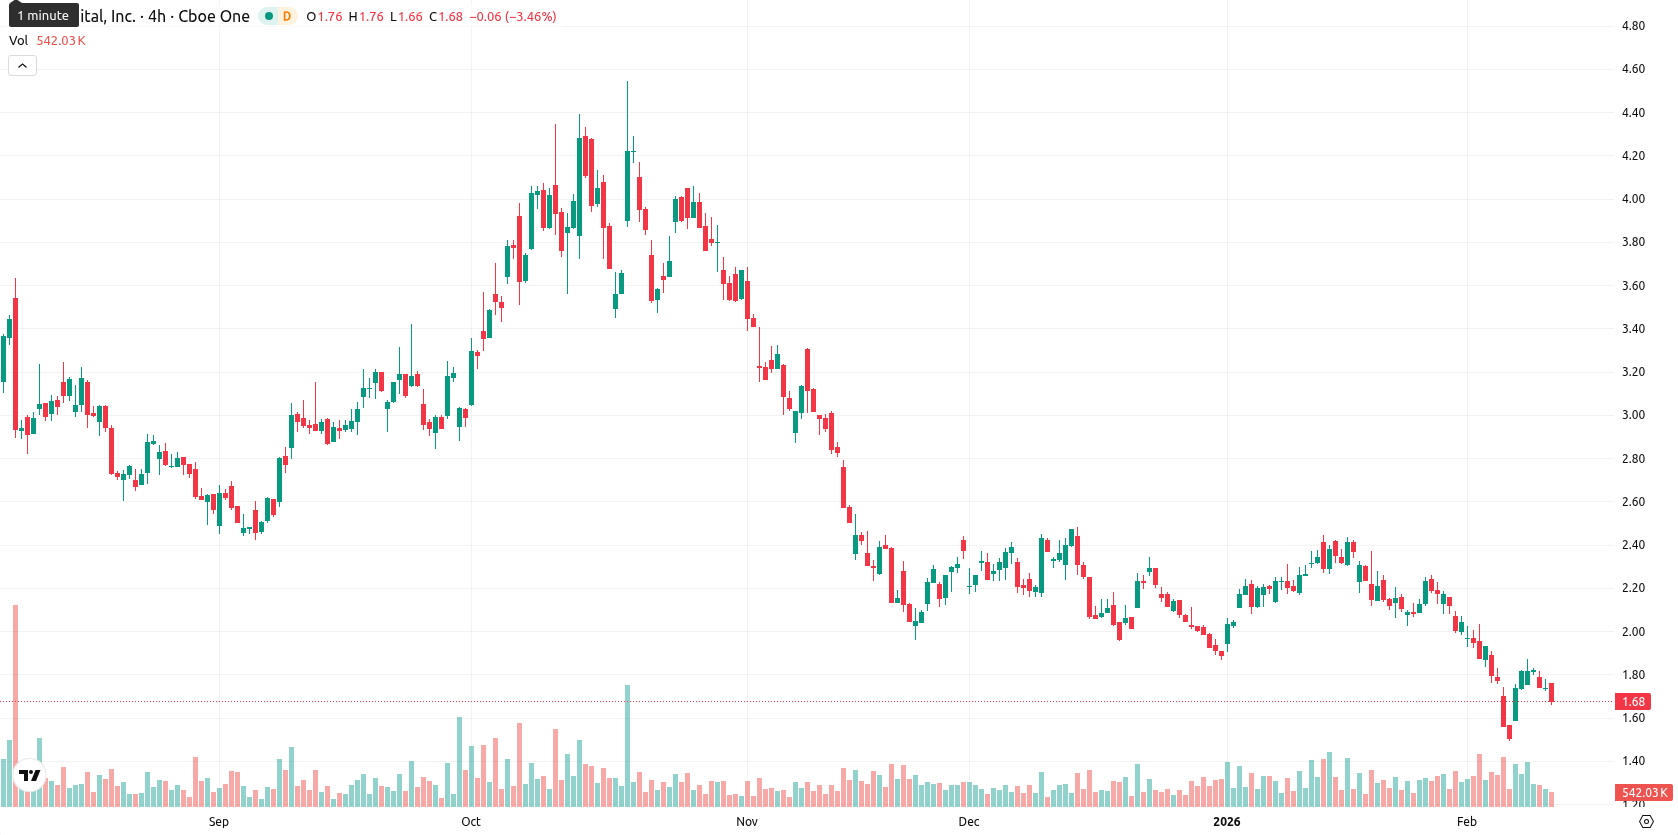
Bit Digital Inc (BTBT) is trading at $1.68 after declining 3.61% intraday, showing pronounced volatility and pressure throughout the session. The asset is well below key moving averages — MA-20 at $2.06, MA-50 at $2.13, and MA-200 at $2.70 — which supports the view of sustained selling momentum across all timeframes.
Highlights
- BTBT trades at $1.68, well below the MA-20 ($2.06), MA-50 ($2.13), and MA-200 ($2.70), indicating persistent multi-timeframe selling pressure.
- MACD is on a daily sell signal, RSI at 38.20, and CCI at –105.84 confirm oversold conditions and sustained downside momentum.
- Short-term support is near $1.60 with resistance at $1.97; a sub-20% probability exists for a meaningful rebound above these levels in the next five days.
Technical breakdown confirmed as momentum indicators reinforce bearish signals
The technical outlook remains bearish with BTBT notably underperforming major moving averages, as the price is suppressed below MA-20, MA-50, and MA-200, and dynamic resistance set by the Ichimoku Kijun at $1.97. Immediate support is marked by the day's intraday low and round psychological levels near $1.50. Momentum indicators reinforce the downside scenario: the MACD issues a daily sell signal and ADX at 15.30 reveals a trend lacking strength, while RSI at 38.20, CCI at –105.84, and Stochastic RSI on lower timeframes all indicate oversold conditions. Persistent negative signals from Bull/Bear Power and the Awesome Oscillator confirm sellers' dominance, and no divergence among momentum or oscillators suggests losses are in line with established downside pressure.
Low probability of rebound as short-term range favors downside
Over the next five trading days, BTBT is expected to trade within a typical volatility band of $1.60 to $1.85 relative to current levels. The probability of a meaningful upward move remains below 20%, implying further near-term weakness is more probable. Base case is for sideways movement between support at $1.60 and resistance near $1.97, while a break above $1.97 would open room toward $1.85, and a decline below $1.60 could accelerate losses toward lower psychological support levels.
Previously it was reported that Bit Digital Inc is trading below all major moving averages, with persistent selling pressure and weak daily momentum indicators, including a soft MACD, ADX, and an RSI near oversold levels. Intraday, prices are approaching immediate support with sellers remaining in control, while key resistance stands at $1.97 and support near $1.63, reflecting ongoing volatility and a lack of meaningful upside strength.


Latest Bit Digital News


-
 Afghanistan
-
 Albania
-
 Algeria
-
 Angola
-
 Argentina
-
 Armenia
-
 Australia
-
 Austria
-
 Azerbaijan
-
 Bahamas
-
 Bahrain
-
 Bangladesh
-
 Belarus
-
 Belgium
-
 Bolivia
-
 Botswana
-
 Brazil
-
 Brunei
-
 Bulgaria
-
 Cambodia
-
 Cameroon
-
 Canada
-
 Chile
Chile
-
 China
China
-
 Colombia
-
 Congo
Congo
-
 Costa Rica
-
 Cote d'Ivoire
-
 Croatia
-
 Cuba
Cuba
-
 Cyprus
-
 Czechia
-
 DR Congo
-
 Denmark
-
 Dominican Republic
-
 Ecuador
-
 Egypt
Egypt
-
 El Salvador
-
 Estonia
-
 Eswatini
-
 Ethiopia
-
 Finland
-
 France
-
 Georgia
-
 Germany
-
 Ghana
Ghana
-
 Greece
-
 Haiti
Haiti
-
 Hong Kong
-
 Hungary
-
 India
India
-
 Indonesia
-
 Iran, Islamic republic
-
 Iraq
Iraq
-
 Ireland
-
 Israel
-
 Italy
Italy
-
 Jamaica
-
 Japan
Japan
-
 Jordan
-
 Kazakhstan
-
 Kenya
Kenya
-
 Korea
Korea
-
 Kuwait
-
 Kyrgyzstan
-
 Laos
Laos
-
 Latvia
-
 Lebanon
-
 Lesotho
-
 Libya
Libya
-
 Lithuania
-
 Luxembourg
-
 Madagascar
-
 Malaysia
-
 Malta
Malta
-
 Mauritius
-
 Mexico
-
 Moldova
-
 Mongolia
-
 Montenegro
-
 Morocco
-
 Mozambique
-
 Myanmar
-
 Namibia
-
 Nepal
Nepal
-
 Netherlands
-
 New Zealand
-
 Nigeria
-
 North Macedonia
-
 Norway
-
 Oman
Oman
-
 Pakistan
-
 Palestine
-
 Panama
-
 Papua New Guinea
-
 Paraguay
-
 Peru
Peru
-
 Philippines
-
 Poland
-
 Portugal
-
 Puerto Rico
-
 Qatar
Qatar
-
 Reunion
-
 Romania
-
 Rwanda
-
 Saudi Arabia
-
 Serbia
-
 Singapore
-
 Slovakia
-
 Slovenia
-
 Somalia
-
 South Africa
-
 Spain
Spain
-
 Sri Lanka
-
 Sweden
-
 Switzerland
-
 Syria
Syria
-
 Taiwan
-
 Tajikistan
-
 Tanzania
-
 Thailand
-
 Trinidad and Tobago
-
 Tunisia
-
 Turkey
-
 UAE
UAE
-
 Uganda
-
 Ukraine
-
 United Kingdom
-
United States
-
 Uruguay
-
 Uzbekistan
-
 Venezuela
-
 Vietnam
-
 Yemen
Yemen
-
 Zambia
-
 Zimbabwe
- Forex
- Crypto
