
T-Mobile stock: Upbeat outlook and UScellular deal fuel a sharp daily gain

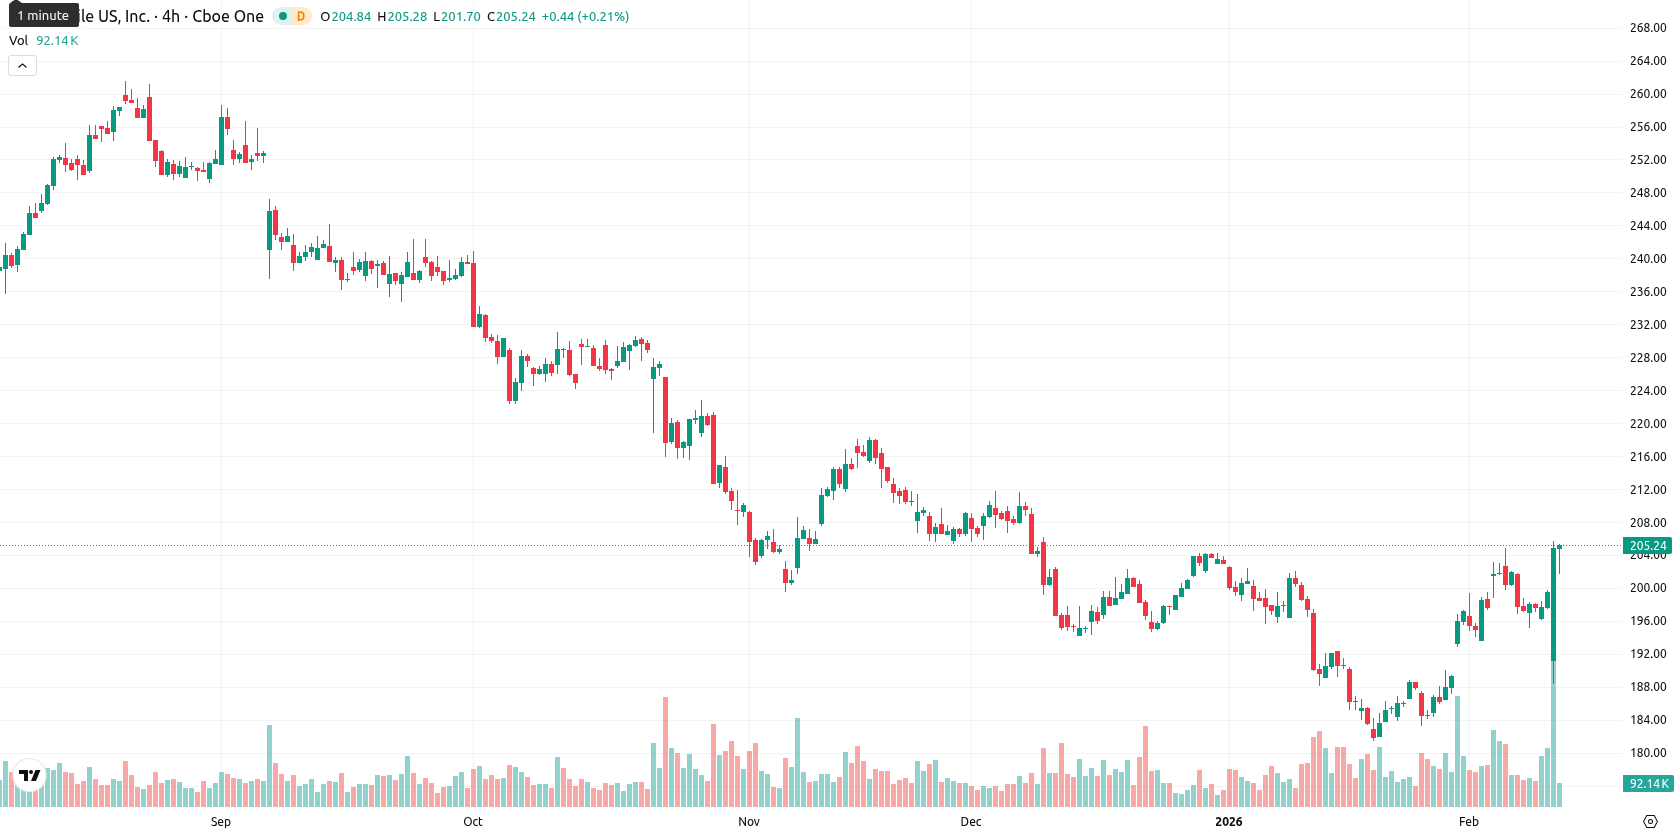
T-Mobile US, Inc. (TMUS) is trading at $207.60 after a $8.17 or 4.10% gain on the day. TMUS stands above its MA-20 at $191.68 and MA-50 at $197.27, but remains below the MA-200 at $225.13, reflecting positive short- and medium-term momentum with longer-term resistance still in place.
Highlights
- T-Mobile raised its multi-year growth outlook through 2027 after strong Q4 results, citing gains in wireless, broadband, and new business segments.
- Over $20 billion has been returned to shareholders since 2024 via dividends and buybacks, with accelerated repurchases planned for Q1 2026 and beyond.
- TMUS trades at $207.60 above MA-20 and MA-50 but below MA-200, with key support at $197.27 and a projected price range of $198–$215 for the coming week.
Shareholder returns expand as business segments and outlook accelerate
T-Mobile reported strong fourth-quarter financial and operational results, raising its multi-year growth outlook through 2027 fueled by gains in wireless, broadband, and new business segments. The company completed the acquisition of UScellular, made further investments in joint ventures, and advanced new AI-powered network services. Over $20 billion has been returned to shareholders since 2024 through dividends and buybacks, with accelerated repurchases planned for Q1 2026 and beyond. Deutsche Telekom confirmed it plans to keep its majority stake, supporting T-Mobile’s strategic direction.
Persistently strong intraday momentum as volatility and overbought signals rise
Momentum signals are mixed: the MACD is neutral, while the ADX on D1 indicates a moderate trend. The RSI remains in bullish territory, but both Stochastic RSI and Bull/Bear Power point to overbought conditions, suggesting recent buyer dominance. The Commodity Channel Index aligns with ongoing buyer interest, and the Awesome Oscillator supports the upward momentum. Notably, after starting the session with a significant gap down, TMUS reversed course and now trades near session highs, highlighting persistent intraday strength and high volatility.
Short-term risks tilt toward decline amid established volatility range
For the coming week, TMUS is likely to trade between $198 and $215, with this price range representing a typical volatility band relative to current levels. The probability of further gains is under 20%, implying a higher likelihood of a short-term decline or sideways consolidation. If the price breaks above $215, accelerated gains toward the next resistance could follow, while a drop below $198 may trigger additional selling pressure.
Previously it was reported that T-Mobile US, Inc. is trading just above its 20-day moving average but remains under its 50-day and well below the 200-day, signaling short-term support amid lingering medium- and long-term selling pressure. Technical indicators are mixed, with momentum and oscillators revealing bullish undertones but showing signs of buyer fatigue and heightened volatility, while immediate support and resistance are identified near the Ichimoku Kijun and the 50-day moving average, respectively.


-
 Afghanistan
-
 Albania
-
 Algeria
-
 Angola
-
 Argentina
-
 Armenia
-
 Australia
-
 Austria
-
 Azerbaijan
-
 Bahamas
-
 Bahrain
-
 Bangladesh
-
 Belarus
-
 Belgium
-
 Bolivia
-
 Botswana
-
 Brazil
-
 Brunei
-
 Bulgaria
-
 Cambodia
-
 Cameroon
-
 Canada
-
 Chile
Chile
-
 China
China
-
 Colombia
-
 Congo
Congo
-
 Costa Rica
-
 Cote d'Ivoire
-
 Croatia
-
 Cuba
Cuba
-
 Cyprus
-
 Czechia
-
 DR Congo
-
 Denmark
-
 Dominican Republic
-
 Ecuador
-
 Egypt
Egypt
-
 El Salvador
-
 Estonia
-
 Eswatini
-
 Ethiopia
-
 Finland
-
 France
-
 Georgia
-
 Germany
-
 Ghana
Ghana
-
 Greece
-
 Haiti
Haiti
-
 Hong Kong
-
 Hungary
-
 India
India
-
 Indonesia
-
 Iran, Islamic republic
-
 Iraq
Iraq
-
 Ireland
-
 Israel
-
 Italy
Italy
-
 Jamaica
-
 Japan
Japan
-
 Jordan
-
 Kazakhstan
-
 Kenya
Kenya
-
 Korea
Korea
-
 Kuwait
-
 Kyrgyzstan
-
 Laos
Laos
-
 Latvia
-
 Lebanon
-
 Lesotho
-
 Libya
Libya
-
 Lithuania
-
 Luxembourg
-
 Madagascar
-
 Malaysia
-
 Malta
Malta
-
 Mauritius
-
 Mexico
-
 Moldova
-
 Mongolia
-
 Montenegro
-
 Morocco
-
 Mozambique
-
 Myanmar
-
 Namibia
-
 Nepal
Nepal
-
 Netherlands
-
 New Zealand
-
 Nigeria
-
 North Macedonia
-
 Norway
-
 Oman
Oman
-
 Pakistan
-
 Palestine
-
 Panama
-
 Papua New Guinea
-
 Paraguay
-
 Peru
Peru
-
 Philippines
-
 Poland
-
 Portugal
-
 Puerto Rico
-
 Qatar
Qatar
-
 Reunion
-
 Romania
-
 Rwanda
-
 Saudi Arabia
-
 Serbia
-
 Singapore
-
 Slovakia
-
 Slovenia
-
 Somalia
-
 South Africa
-
 Spain
Spain
-
 Sri Lanka
-
 Sweden
-
 Switzerland
-
 Syria
Syria
-
 Taiwan
-
 Tajikistan
-
 Tanzania
-
 Thailand
-
 Trinidad and Tobago
-
 Tunisia
-
 Turkey
-
 UAE
UAE
-
 Uganda
-
 Ukraine
-
 United Kingdom
-
United States
-
 Uruguay
-
 Uzbekistan
-
 Venezuela
-
 Vietnam
-
 Yemen
Yemen
-
 Zambia
-
 Zimbabwe
- Forex
- Crypto
