
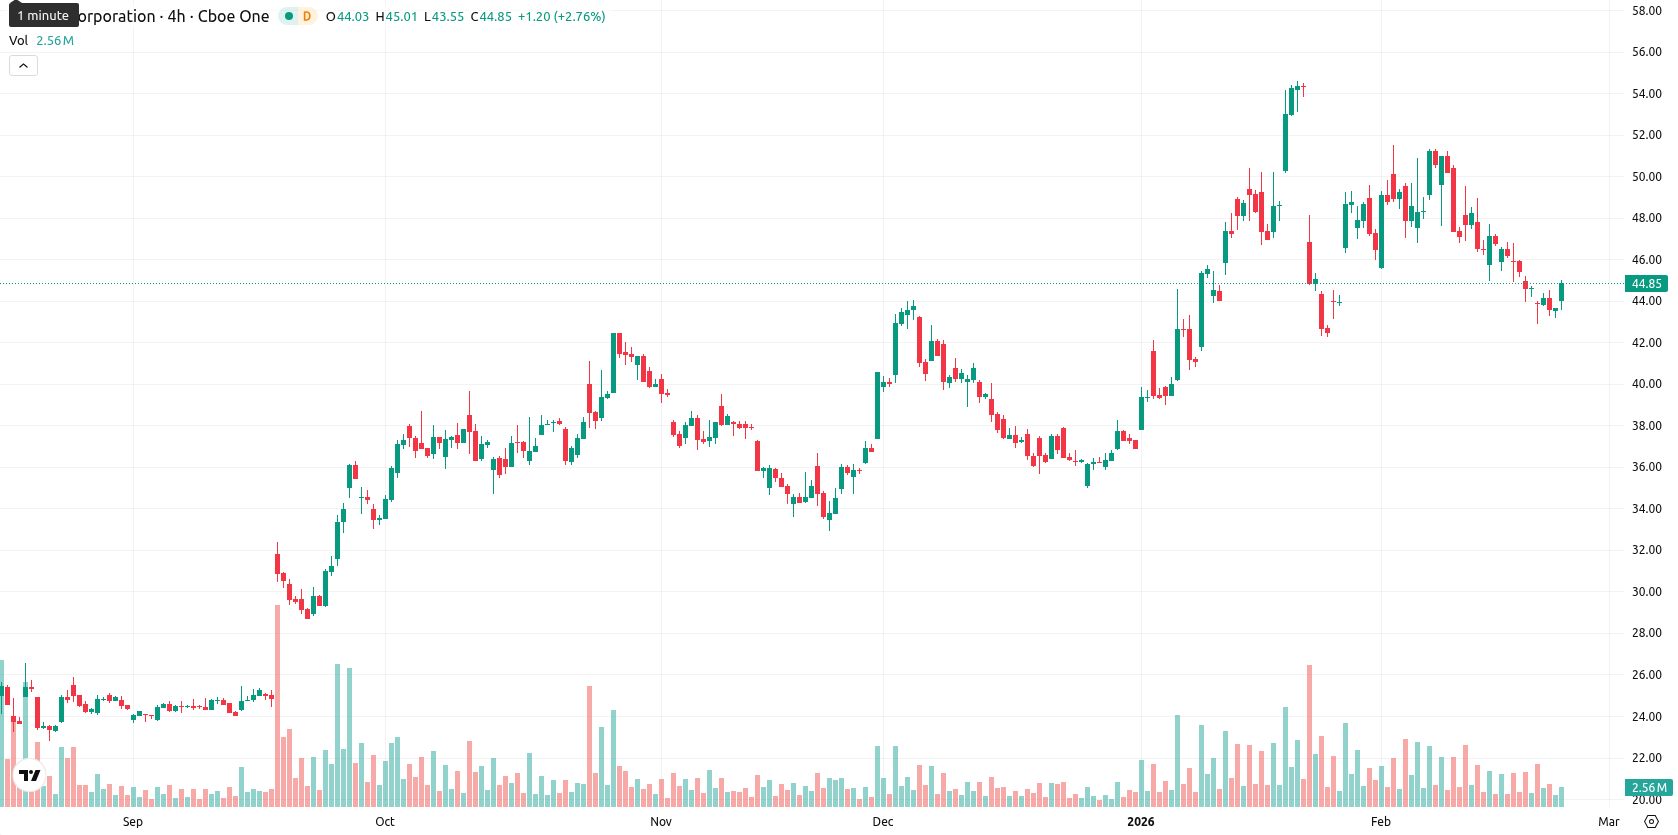
Intel stock rises 3.00% as technical rebound draws buyers despite short-term selling

Intel Corporation (INTC) is trading at $44.93, positioned below its MA-20 ($46.94), above the MA-50 ($43.65), and comfortably above the MA-200 ($31.85), reflecting short-term pressure but a still favorable medium- and long-term technical trend. Immediate resistance is indicated at the Ichimoku Kijun level of $48.44.
Highlights
- Intel shares are trading at $44.93, below the MA-20 ($46.94) but above the MA-50 ($43.65) and MA-200 ($31.85), reflecting short-term selling but maintaining medium- and long-term bullish structure.
- Despite oversold readings on Stochastic RSI (0.00) and Commodity Channel Index (–115.86), seller momentum persists with intraday Bull/Bear Power at –1.53 and the Awesome Oscillator remaining bearish.
- For next week, expected price range is $43.00–$46.00 with sideways movement likely; a bullish scenario requires a breakout above the Ichimoku Kijun at $48.44.
Mixed momentum as oversold readings clash with seller control
Momentum signals present a mixed outlook: both MACD and ADX are neutral on the daily chart, while the RSI sits slightly bearish at 43.40. Oscillators, including Stochastic RSI (0.00) and Commodity Channel Index (–115.86), are registering oversold conditions that may prompt a technical rebound, but negative Bull/Bear Power (–1.53) and bearish alignment on the Awesome Oscillator highlight ongoing selling pressure intraday. A moderate gap up at the open has been followed by trading near today’s high, with intraday volatility remaining moderate. Despite buyer interest following this morning's strength, the divergence between oversold signals and continuous seller momentum underscores short-term uncertainty.
Sideways move likely as weekly signals favor bulls
Over the next week, the anticipated price range for Intel is $43.00 – $46.00, reflecting typical volatility for a blue-chip stock and a likely sideways movement. The probability of an upward move is high (over 80%), as major weekly indicators — RSI, ADX, MACD, and the MA-50 — all flash 'Buy' or 'Strong Buy' signals, making a significant decline less probable. The baseline scenario projects Intel moving within this support and resistance corridor; a bullish breakout would require sustained gains above the Ichimoku Kijun near $48.44, while a bearish turn could emerge on a drop under the $43.00 – $43.65 band.
Last time, analysts noted that Intel is trading below its short-term moving averages, with ongoing seller pressure and mixed momentum signals indicating bearish sentiment, although multiple oscillators highlight oversold conditions and potential for a reversal. The stock finds immediate resistance near the Ichimoku Kijun and support at its 50-day moving average, amid elevated volatility and persistent margin and execution risks from its evolving AI and manufacturing strategies.


-
 Afghanistan
-
 Albania
-
 Algeria
-
 Angola
-
 Argentina
-
 Armenia
-
 Australia
-
 Austria
-
 Azerbaijan
-
 Bahamas
-
 Bahrain
-
 Bangladesh
-
 Belarus
-
 Belgium
-
 Bolivia
-
 Botswana
-
 Brazil
-
 Brunei
-
 Bulgaria
-
 Cambodia
-
 Cameroon
-
 Canada
-
 Chile
Chile
-
 China
China
-
 Colombia
-
 Congo
Congo
-
 Costa Rica
-
 Cote d'Ivoire
-
 Croatia
-
 Cuba
Cuba
-
 Cyprus
-
 Czechia
-
 DR Congo
-
 Denmark
-
 Dominican Republic
-
 Ecuador
-
 Egypt
Egypt
-
 El Salvador
-
 Estonia
-
 Eswatini
-
 Ethiopia
-
 Finland
-
 France
-
 Georgia
-
 Germany
-
 Ghana
Ghana
-
 Greece
-
 Haiti
Haiti
-
 Hong Kong
-
 Hungary
-
 India
India
-
 Indonesia
-
 Iran, Islamic republic
-
 Iraq
Iraq
-
 Ireland
-
 Israel
-
 Italy
Italy
-
 Jamaica
-
 Japan
Japan
-
 Jordan
-
 Kazakhstan
-
 Kenya
Kenya
-
 Korea
Korea
-
 Kuwait
-
 Kyrgyzstan
-
 Laos
Laos
-
 Latvia
-
 Lebanon
-
 Lesotho
-
 Libya
Libya
-
 Lithuania
-
 Luxembourg
-
 Madagascar
-
 Malaysia
-
 Malta
Malta
-
 Mauritius
-
 Mexico
-
 Moldova
-
 Mongolia
-
 Montenegro
-
 Morocco
-
 Mozambique
-
 Myanmar
-
 Namibia
-
 Nepal
Nepal
-
 Netherlands
-
 New Zealand
-
 Nigeria
-
 North Macedonia
-
 Norway
-
 Oman
Oman
-
 Pakistan
-
 Palestine
-
 Panama
-
 Papua New Guinea
-
 Paraguay
-
 Peru
Peru
-
 Philippines
-
 Poland
-
 Portugal
-
 Puerto Rico
-
 Qatar
Qatar
-
 Reunion
-
 Romania
-
 Rwanda
-
 Saudi Arabia
-
 Serbia
-
 Singapore
-
 Slovakia
-
 Slovenia
-
 Somalia
-
 South Africa
-
 Spain
Spain
-
 Sri Lanka
-
 Sweden
-
 Switzerland
-
 Syria
Syria
-
 Taiwan
-
 Tajikistan
-
 Tanzania
-
 Thailand
-
 Trinidad and Tobago
-
 Tunisia
-
 Turkey
-
 UAE
UAE
-
 Uganda
-
 Ukraine
-
 United Kingdom
-
United States
-
 Uruguay
-
 Uzbekistan
-
 Venezuela
-
 Vietnam
-
 Yemen
Yemen
-
 Zambia
-
 Zimbabwe
- Forex
- Crypto
