
MercadoLibre stock rises 3.01% as technical signals point to oversold conditions after volatile open

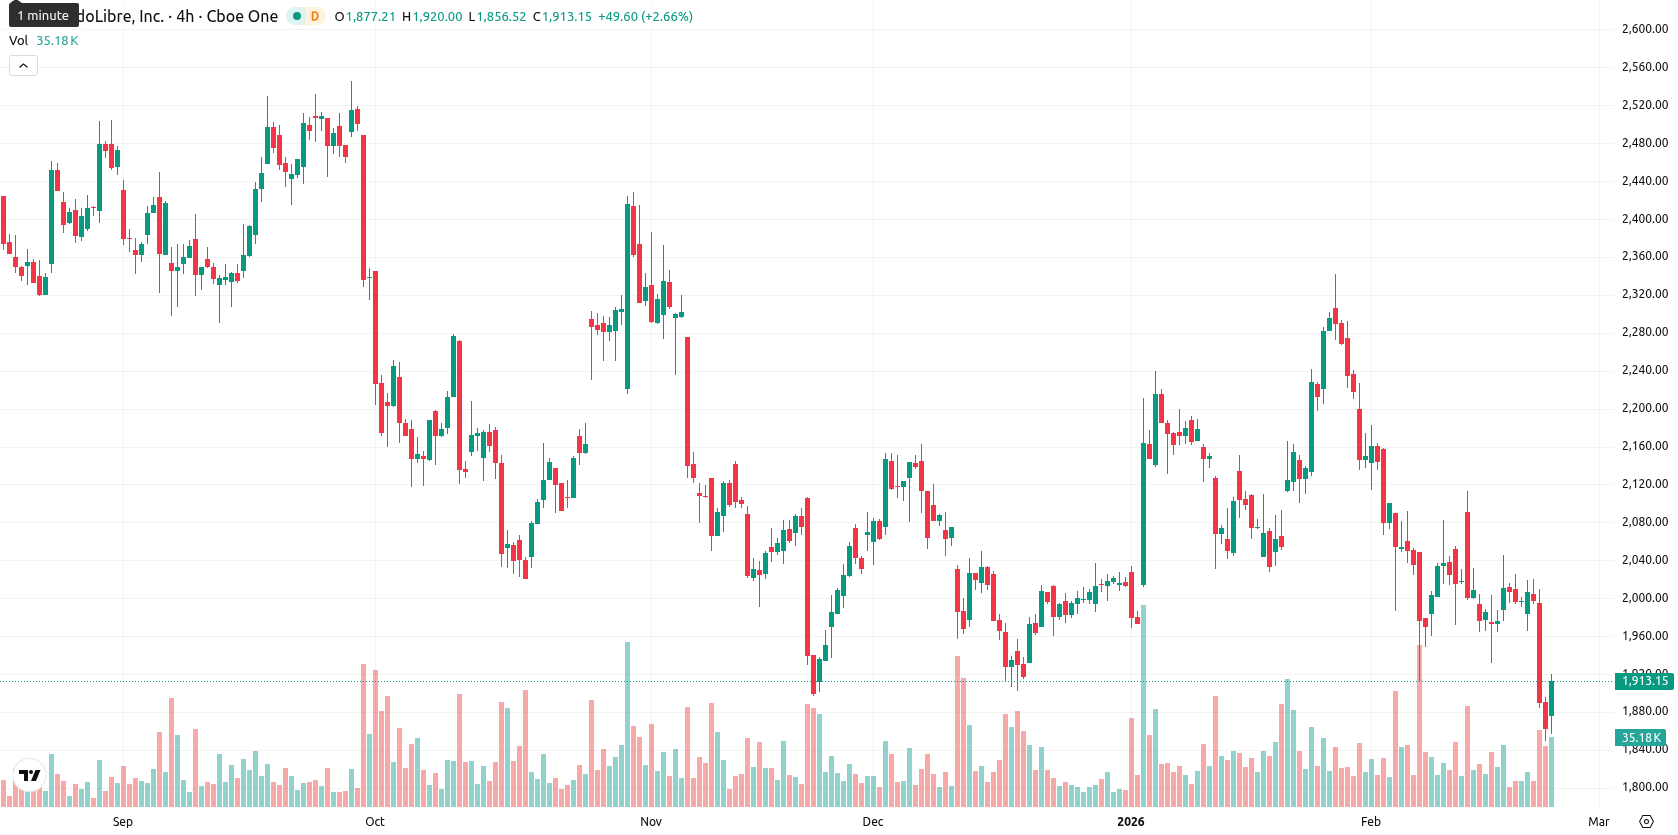
MercadoLibre Inc (MELI) is trading at $1,920.65 after a 3.01% daily gain, with the price remaining below the MA-20 ($2,068.19), MA-50 ($2,058.10), and MA-200 ($2,269.07), reflecting persistent downward pressure across all major trend horizons. The Ichimoku Kijun at $2,095.73 serves as the nearest technical resistance.
Highlights
- MercadoLibre reported Q4 earnings per share of $8.32, missing consensus estimates of $9.30 by 10.5%.
- Investors are scrutinizing MercadoLibre's revenue growth, margin durability, and valuation following the weaker-than-expected earnings release.
- The current price of $1,920.65 remains below key moving averages and resistance, with downside momentum dominating and the next support level at $1,850.
Valuation scrutiny intensifies as earnings miss spurs margin concerns
MercadoLibre reported fourth quarter earnings with earnings per share of $8.32, missing the consensus estimate of $9.30 by 10.5%. Investors are focused on the company's revenue growth and profitability signals after this latest earnings release. Margin durability and valuation remain under scrutiny following the results.
Broad oversold signals and negative momentum sustain downside risk
Technical analysis shows that momentum indicators such as the MACD remain deeply negative, while the ADX points to a weak and indecisive trend. The RSI, Stochastic RSI, and CCI all indicate oversold conditions, yet the Bull/Bear Power remains clearly negative, signaling that sellers dominate intraday activity. Although there was a gap higher at the open and the price trades near today’s high on elevated volatility, the Awesome Oscillator supports the overall downtrend, highlighting a potential relief move rather than a true reversal.
Limited upside seen as bearish forces dominate within volatility range
Over the next five sessions, MELI is expected to trade within a volatility band of $1,850 – $2,050. The probability of upside movement is low at under 20%, making a further decline the more likely scenario. The base case anticipates continued sideways trading within this range, as sellers and short-term bargain hunters compete for direction. A bullish breakout requires a close above $2,050 and the Ichimoku Kijun, whereas a fall below $1,850 could trigger additional downside momentum ahead of the next support zone.
Previously it was reported that MercadoLibre Inc. is trading well below its short, medium, and long-term moving averages, confirming a firm bearish structure across multiple timeframes, with immediate resistance defined by Ichimoku Kijun. Despite a recent intraday gain and oversold readings on RSI-based indicators suggesting potential seller exhaustion, the overall momentum remains weak as reflected by bearish signals in MACD and ADX, indicating persistent downward pressure.


Latest MercadoLibre News


-
 Afghanistan
-
 Albania
-
 Algeria
-
 Angola
-
 Argentina
-
 Armenia
-
 Australia
-
 Austria
-
 Azerbaijan
-
 Bahamas
-
 Bahrain
-
 Bangladesh
-
 Belarus
-
 Belgium
-
 Bolivia
-
 Botswana
-
 Brazil
-
 Brunei
-
 Bulgaria
-
 Cambodia
-
 Cameroon
-
 Canada
-
 Chile
Chile
-
 China
China
-
 Colombia
-
 Congo
Congo
-
 Costa Rica
-
 Cote d'Ivoire
-
 Croatia
-
 Cuba
Cuba
-
 Cyprus
-
 Czechia
-
 DR Congo
-
 Denmark
-
 Dominican Republic
-
 Ecuador
-
 Egypt
Egypt
-
 El Salvador
-
 Estonia
-
 Eswatini
-
 Ethiopia
-
 Finland
-
 France
-
 Georgia
-
 Germany
-
 Ghana
Ghana
-
 Greece
-
 Haiti
Haiti
-
 Hong Kong
-
 Hungary
-
 India
India
-
 Indonesia
-
 Iran, Islamic republic
-
 Iraq
Iraq
-
 Ireland
-
 Israel
-
 Italy
Italy
-
 Jamaica
-
 Japan
Japan
-
 Jordan
-
 Kazakhstan
-
 Kenya
Kenya
-
 Korea
Korea
-
 Kuwait
-
 Kyrgyzstan
-
 Laos
Laos
-
 Latvia
-
 Lebanon
-
 Lesotho
-
 Libya
Libya
-
 Lithuania
-
 Luxembourg
-
 Madagascar
-
 Malaysia
-
 Malta
Malta
-
 Mauritius
-
 Mexico
-
 Moldova
-
 Mongolia
-
 Montenegro
-
 Morocco
-
 Mozambique
-
 Myanmar
-
 Namibia
-
 Nepal
Nepal
-
 Netherlands
-
 New Zealand
-
 Nigeria
-
 North Macedonia
-
 Norway
-
 Oman
Oman
-
 Pakistan
-
 Palestine
-
 Panama
-
 Papua New Guinea
-
 Paraguay
-
 Peru
Peru
-
 Philippines
-
 Poland
-
 Portugal
-
 Puerto Rico
-
 Qatar
Qatar
-
 Reunion
-
 Romania
-
 Rwanda
-
 Saudi Arabia
-
 Serbia
-
 Singapore
-
 Slovakia
-
 Slovenia
-
 Somalia
-
 South Africa
-
 Spain
Spain
-
 Sri Lanka
-
 Sweden
-
 Switzerland
-
 Syria
Syria
-
 Taiwan
-
 Tajikistan
-
 Tanzania
-
 Thailand
-
 Trinidad and Tobago
-
 Tunisia
-
 Turkey
-
 UAE
UAE
-
 Uganda
-
 Ukraine
-
 United Kingdom
-
United States
-
 Uruguay
-
 Uzbekistan
-
 Venezuela
-
 Vietnam
-
 Yemen
Yemen
-
 Zambia
-
 Zimbabwe
- Forex
- Crypto
