
WTI crude oil price forecast: Can bulls break $67 as Iran talks drive volatility?

WTI crude oil is attempting to stabilize around $66 after experiencing two negative sessions, with traders closely monitoring whether the market can break through a long-standing resistance level. The situation is tense, as geopolitical news is keeping volatility high just as prices approach a major technical ceiling.
Highlights
- WTI holds near $66 after two declines as traders watch the next U.S.-Iran nuclear talks round.
- Charts show bullish short-term momentum, but resistance at $66 to $67 remains the key barrier.
- A close above $67 shifts focus to $70, while a drop below $64 risks a slide toward $62 and $60.
With the U.S.–Iran nuclear discussions and new tariff risks contributing to volatility, the next move depends on whether bulls can achieve a decisive close above $67 or fall back into the $62–$64 support range.
Geopolitics keeps risk premium alive
The immediate focus is on the third round of U.S.-Iran nuclear talks, with markets looking for any indication that diplomacy is faltering. The Strait of Hormuz remains a critical risk area, as approximately 20% of global oil flows through this chokepoint. Any escalation in shipping could quickly drive crude prices higher, while positive statements from either side tend to ease the premium.
President Donald Trump has signaled a preference for a diplomatic outcome while keeping pressure on Tehran. Iranian officials have also indicated willingness to negotiate, leaving crude prices highly sensitive to the next headline. The market’s reaction function has been clear in recent sessions: firmness in talks pulls prices back, while signs of strain lift them.
Resistance test meets a cleaner chart
Technically, crude is trading around $65.9 and remains above the 20-, 50- and 100-day EMAs, clustered roughly between $61.6 and $64.2. That bullish stacking reflects a short-term momentum turn higher after buyers defended the $58 to $60 base in January and produced a steady sequence of higher lows into February.
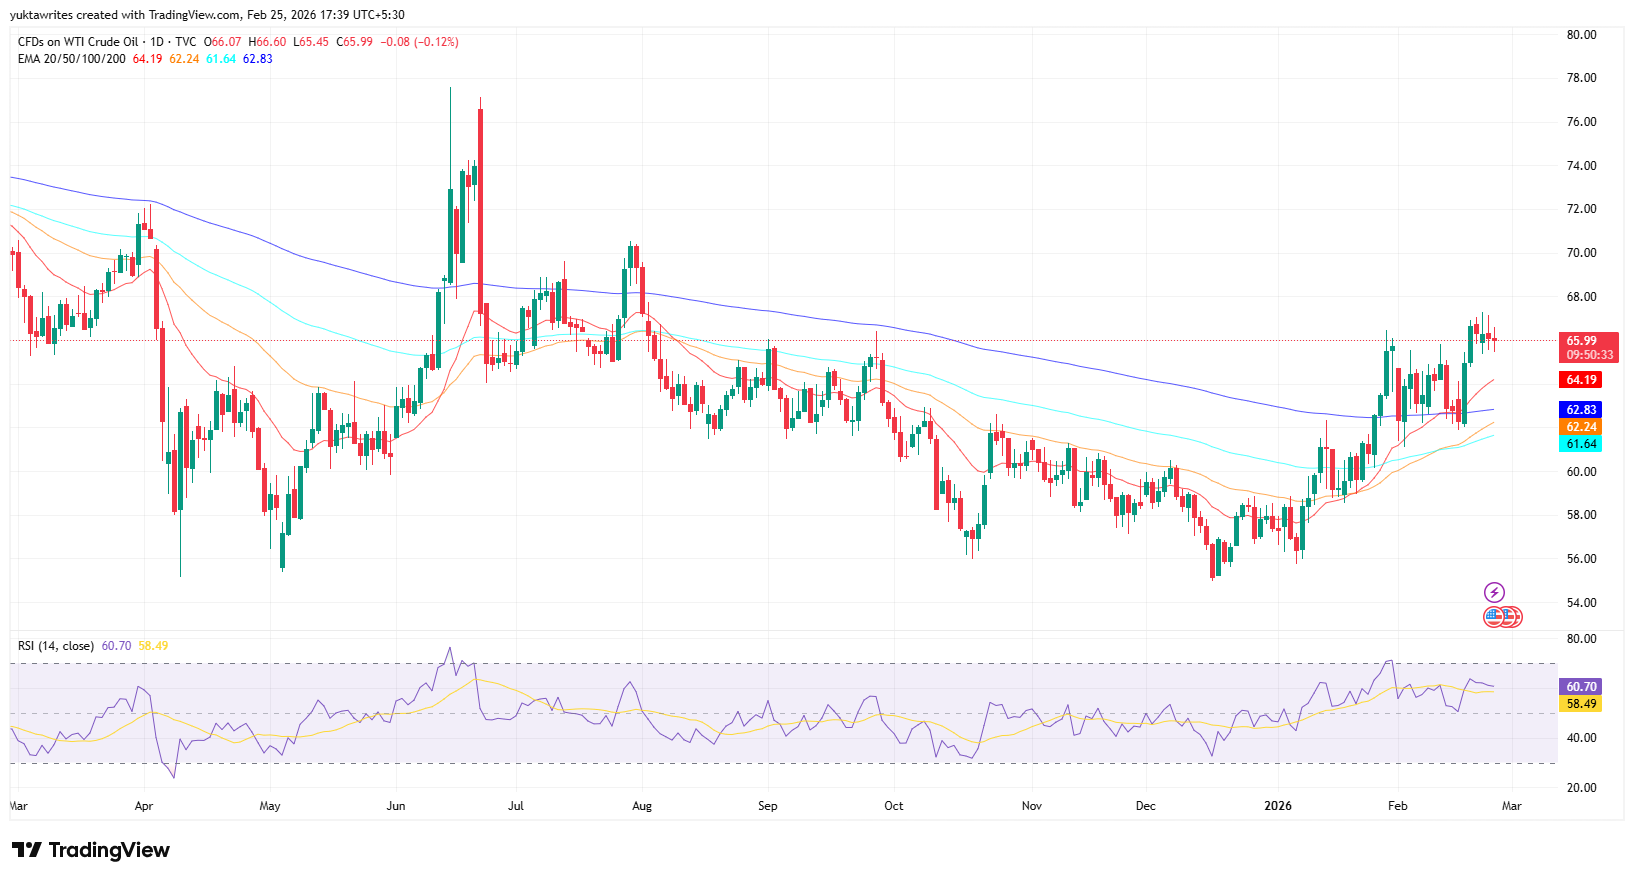
WTI price dynamics (Source: TradingView)
Moreover, price is now pushing into the $66 to $67 zone that has rejected rallies multiple times over the past year. The structure resembles an ascending base pressing into horizontal resistance. If bulls secure a daily close above $67 with stronger follow-through, the next upside window points toward $70, then $73.
If crude stalls at resistance and closes back under $64, the breakout attempt risks becoming a bull trap. In that scenario, first support sits near $62.5, followed by the stronger demand band around $60. A break under $60 would reopen downside focus toward $57.
Growth worries add a second headwind
Beyond geopolitics, traders are still weighing demand risk tied to trade policy. A new 10% U.S. global tariff, and discussion of a potential move to 15%, has added uncertainty to the growth outlook. If trade friction intensifies, demand expectations could cap rallies even if supply risks remain elevated.
As previously discussed, WTI has repeatedly struggled to sustain moves above the mid-$60, making the current $66 to $67 test the market’s clearest signal for whether momentum can extend or fades back into a range.


Latest WTI News


-
 Afghanistan
-
 Albania
-
 Algeria
-
 Angola
-
 Argentina
-
 Armenia
-
 Australia
-
 Austria
-
 Azerbaijan
-
 Bahamas
-
 Bahrain
-
 Bangladesh
-
 Belarus
-
 Belgium
-
 Bolivia
-
 Botswana
-
 Brazil
-
 Brunei
-
 Bulgaria
-
 Cambodia
-
 Cameroon
-
 Canada
-
 Chile
Chile
-
 China
China
-
 Colombia
-
 Congo
Congo
-
 Costa Rica
-
 Cote d'Ivoire
-
 Croatia
-
 Cuba
Cuba
-
 Cyprus
-
 Czechia
-
 DR Congo
-
 Denmark
-
 Dominican Republic
-
 Ecuador
-
 Egypt
Egypt
-
 El Salvador
-
 Estonia
-
 Eswatini
-
 Ethiopia
-
 Finland
-
 France
-
 Georgia
-
 Germany
-
 Ghana
Ghana
-
 Greece
-
 Haiti
Haiti
-
 Hong Kong
-
 Hungary
-
 India
India
-
 Indonesia
-
 Iran, Islamic republic
-
 Iraq
Iraq
-
 Ireland
-
 Israel
-
 Italy
Italy
-
 Jamaica
-
 Japan
Japan
-
 Jordan
-
 Kazakhstan
-
 Kenya
Kenya
-
 Korea
Korea
-
 Kuwait
-
 Kyrgyzstan
-
 Laos
Laos
-
 Latvia
-
 Lebanon
-
 Lesotho
-
 Libya
Libya
-
 Lithuania
-
 Luxembourg
-
 Madagascar
-
 Malaysia
-
 Malta
Malta
-
 Mauritius
-
 Mexico
-
 Moldova
-
 Mongolia
-
 Montenegro
-
 Morocco
-
 Mozambique
-
 Myanmar
-
 Namibia
-
 Nepal
Nepal
-
 Netherlands
-
 New Zealand
-
 Nigeria
-
 North Macedonia
-
 Norway
-
 Oman
Oman
-
 Pakistan
-
 Palestine
-
 Panama
-
 Papua New Guinea
-
 Paraguay
-
 Peru
Peru
-
 Philippines
-
 Poland
-
 Portugal
-
 Puerto Rico
-
 Qatar
Qatar
-
 Reunion
-
 Romania
-
 Rwanda
-
 Saudi Arabia
-
 Serbia
-
 Singapore
-
 Slovakia
-
 Slovenia
-
 Somalia
-
 South Africa
-
 Spain
Spain
-
 Sri Lanka
-
 Sweden
-
 Switzerland
-
 Syria
Syria
-
 Taiwan
-
 Tajikistan
-
 Tanzania
-
 Thailand
-
 Trinidad and Tobago
-
 Tunisia
-
 Turkey
-
 UAE
UAE
-
 Uganda
-
 Ukraine
-
 United Kingdom
-
United States
-
 Uruguay
-
 Uzbekistan
-
 Venezuela
-
 Vietnam
-
 Yemen
Yemen
-
 Zambia
-
 Zimbabwe
- Forex
- Crypto
