
Natural gas price forecast: Winter spike erased as futures sink to $2.86

U.S. natural gas futures are trading around $2.86 per MMBtu, marking a significant decline that has wiped out the winter spike we saw earlier this year. What started as a surge driven by weather conditions towards the $7–$7.5 range has completely reversed, leaving the market in a weak position characterized by lower highs and lower lows.
Highlights
- Natural gas trades near $2.86, well below key moving averages in a firm downtrend.
- Bearish EMA alignment between $3.3 and $3.7 caps rallies for now.
- A break under $2.75 exposes $2.5–$2.4 as the next downside target.
The daily chart shows a consistent downward trend, with prices below the 20-day EMA at about $3.32 and the 50-day EMA around $3.66, both of which are trending downwards. The 100- and 200-day averages are also above the current price, reinforcing the bearish outlook. In a trending market, this configuration usually indicates that any rallies are likely to be temporary corrections rather than signs of a trend reversal.
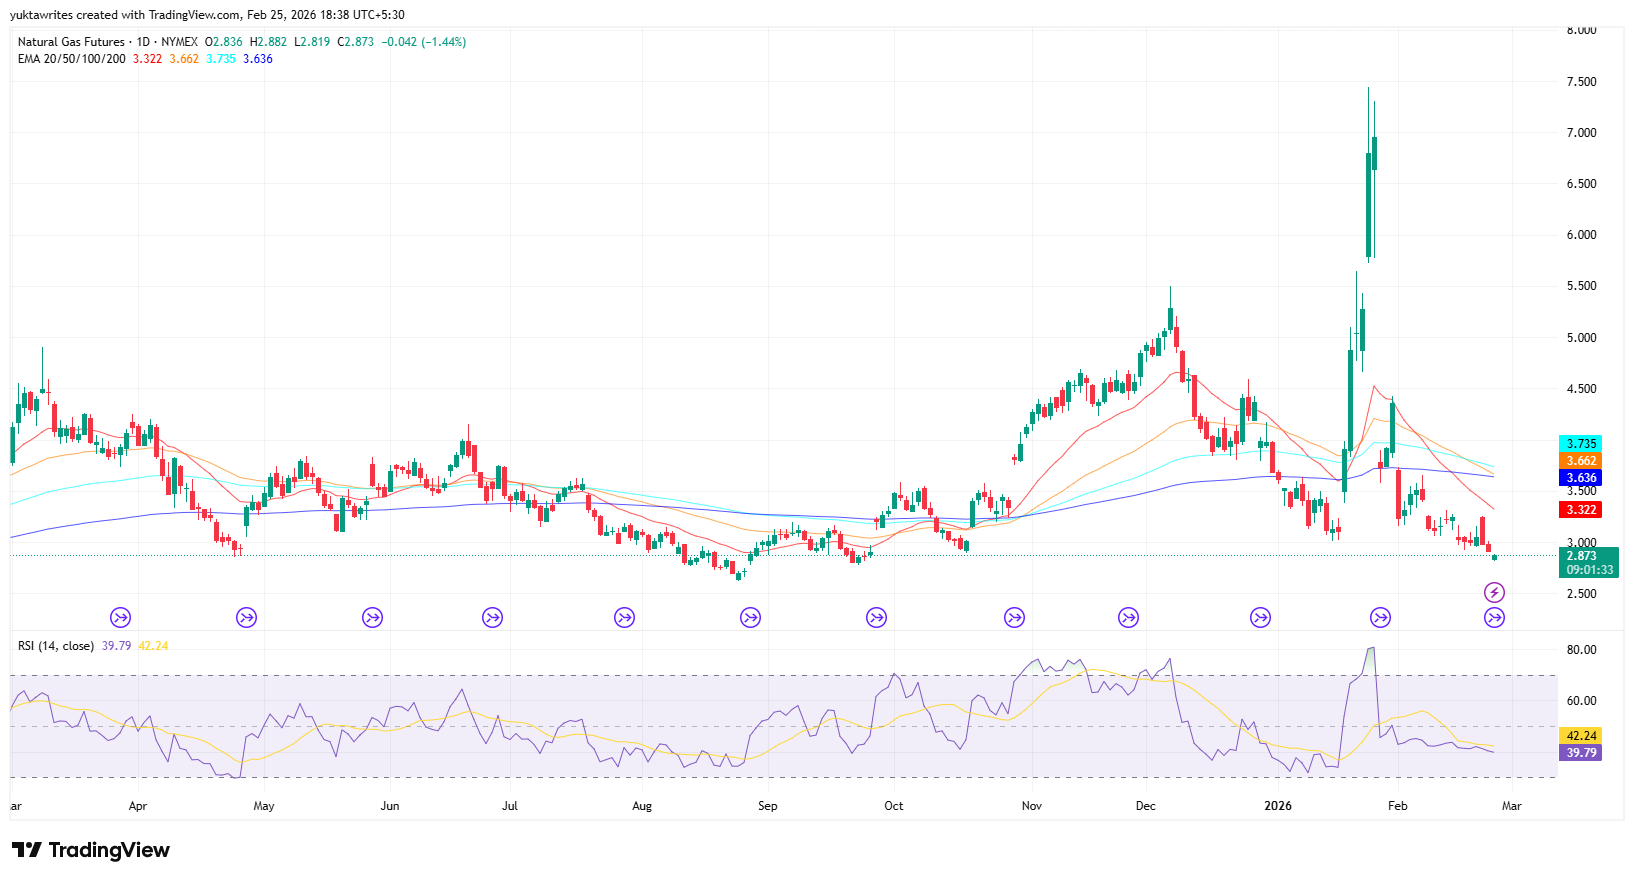
Natural gas price dynamics (Source: TradingView)
Every rebound toward the $3.3 to $3.7 band has attracted selling pressure, turning this area into a strong resistance zone. Momentum indicators support this view, with the RSI near 40 indicating weak buying interest without reaching oversold conditions. In ongoing downtrends, an RSI fluctuating between 30 and 45 often signals continued pressure rather than an imminent turnaround.
Meanwhile, a decisive daily close below $2.75 would open the way toward $2.5 to $2.4, an area that previously served as a launchpad for the last major rally. On the upside, bulls would need a close above $3.3 to begin shifting short-term control, with a move above $3.65 required to neutralize the broader bearish structure.
LNG expansion adds long-term support but near-term weight
Fundamentally, the long-term narrative remains constructive around U.S. LNG expansion. The United States is processing roughly 18 billion cubic feet per day into LNG and plans to raise liquefaction capacity toward 28.7 bcfd by 2029. Two of the world’s largest LNG exporters are now U.S.-based, underscoring the scale of structural demand growth tied to global energy transitions.
However, that infrastructure growth also implies significant supply already in motion. If global LNG markets show signs of saturation, as some industry executives have warned, domestic prices can remain pressured in the interim. Expanded export capacity does not eliminate cyclical imbalances, particularly when weather-driven demand fades.
As previously discussed, natural gas tends to revert sharply after blow-off tops once the weather premium dissipates. The current slide reflects that familiar pattern. Until futures reclaim the $3.30 to $3.65 resistance band on convincing volume, the bias remains tilted to the downside.


Latest Natural Gas News


-
 Afghanistan
-
 Albania
-
 Algeria
-
 Angola
-
 Argentina
-
 Armenia
-
 Australia
-
 Austria
-
 Azerbaijan
-
 Bahamas
-
 Bahrain
-
 Bangladesh
-
 Belarus
-
 Belgium
-
 Bolivia
-
 Botswana
-
 Brazil
-
 Brunei
-
 Bulgaria
-
 Cambodia
-
 Cameroon
-
 Canada
-
 Chile
Chile
-
 China
China
-
 Colombia
-
 Congo
Congo
-
 Costa Rica
-
 Cote d'Ivoire
-
 Croatia
-
 Cuba
Cuba
-
 Cyprus
-
 Czechia
-
 DR Congo
-
 Denmark
-
 Dominican Republic
-
 Ecuador
-
 Egypt
Egypt
-
 El Salvador
-
 Estonia
-
 Eswatini
-
 Ethiopia
-
 Finland
-
 France
-
 Georgia
-
 Germany
-
 Ghana
Ghana
-
 Greece
-
 Haiti
Haiti
-
 Hong Kong
-
 Hungary
-
 India
India
-
 Indonesia
-
 Iran, Islamic republic
-
 Iraq
Iraq
-
 Ireland
-
 Israel
-
 Italy
Italy
-
 Jamaica
-
 Japan
Japan
-
 Jordan
-
 Kazakhstan
-
 Kenya
Kenya
-
 Korea
Korea
-
 Kuwait
-
 Kyrgyzstan
-
 Laos
Laos
-
 Latvia
-
 Lebanon
-
 Lesotho
-
 Libya
Libya
-
 Lithuania
-
 Luxembourg
-
 Madagascar
-
 Malaysia
-
 Malta
Malta
-
 Mauritius
-
 Mexico
-
 Moldova
-
 Mongolia
-
 Montenegro
-
 Morocco
-
 Mozambique
-
 Myanmar
-
 Namibia
-
 Nepal
Nepal
-
 Netherlands
-
 New Zealand
-
 Nigeria
-
 North Macedonia
-
 Norway
-
 Oman
Oman
-
 Pakistan
-
 Palestine
-
 Panama
-
 Papua New Guinea
-
 Paraguay
-
 Peru
Peru
-
 Philippines
-
 Poland
-
 Portugal
-
 Puerto Rico
-
 Qatar
Qatar
-
 Reunion
-
 Romania
-
 Rwanda
-
 Saudi Arabia
-
 Serbia
-
 Singapore
-
 Slovakia
-
 Slovenia
-
 Somalia
-
 South Africa
-
 Spain
Spain
-
 Sri Lanka
-
 Sweden
-
 Switzerland
-
 Syria
Syria
-
 Taiwan
-
 Tajikistan
-
 Tanzania
-
 Thailand
-
 Trinidad and Tobago
-
 Tunisia
-
 Turkey
-
 UAE
UAE
-
 Uganda
-
 Ukraine
-
 United Kingdom
-
United States
-
 Uruguay
-
 Uzbekistan
-
 Venezuela
-
 Vietnam
-
 Yemen
Yemen
-
 Zambia
-
 Zimbabwe
- Forex
- Crypto
