
Amazon trades sideways in volatile range amid persistent selling pressure and lack of reversal signals – weekly analysis

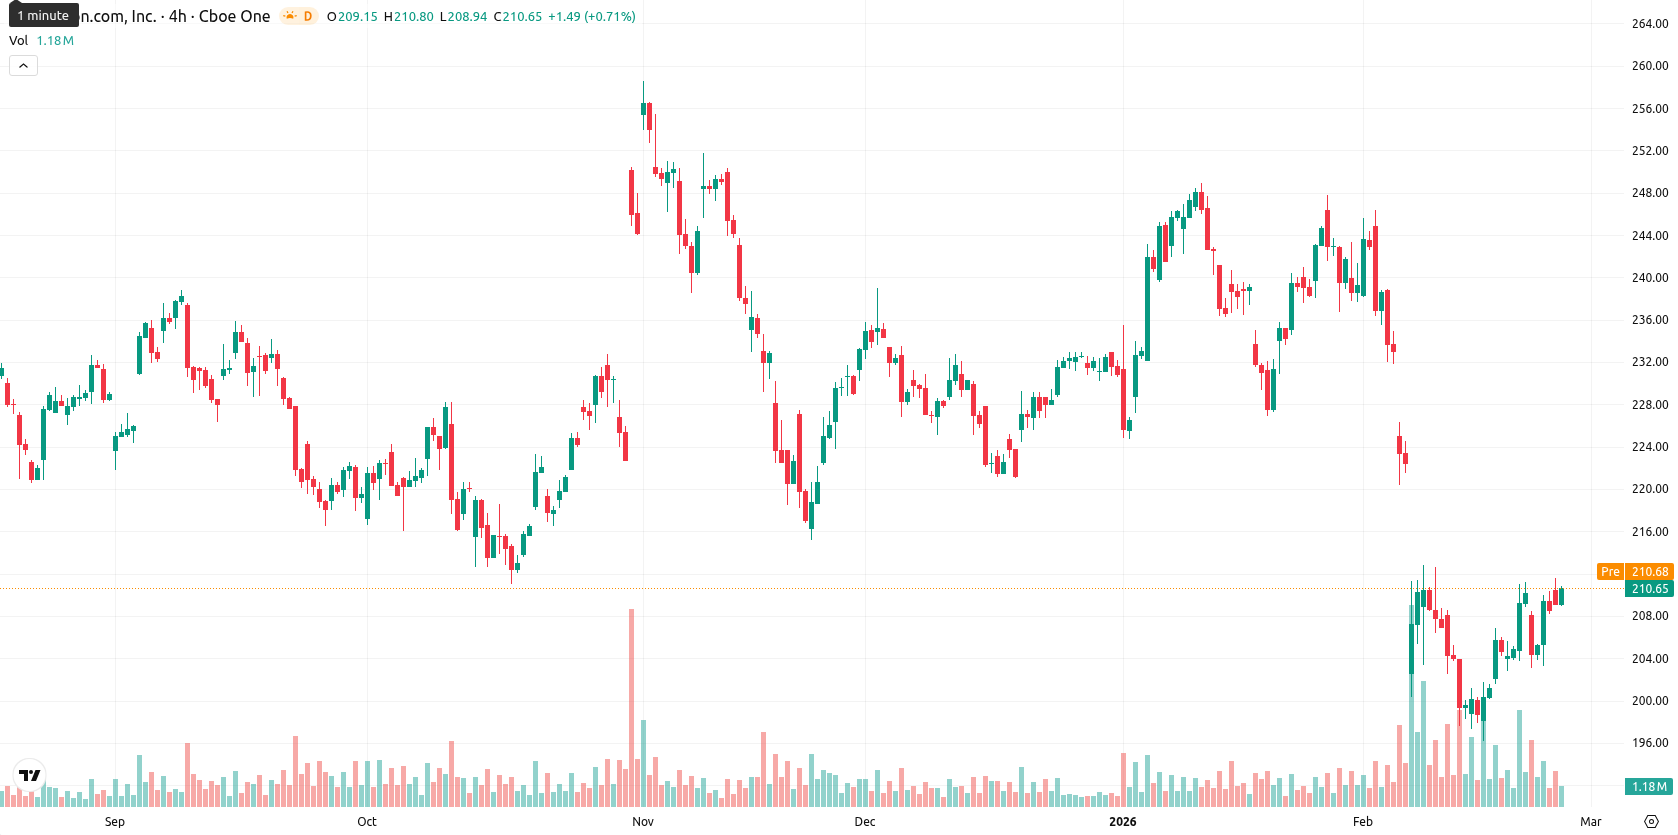
Amazon.com, Inc. (AMZN) is trading at $210.66, marking a loss for the week and falling 2.4% below last week's close. The share price remains under all key weekly moving averages — MA-20 ($216.76), MA-50 ($227.21), and MA-200 ($224.26) — indicating sustained downward momentum and persistent selling pressure over the past seven days.
Highlights
- Amazon shares trade at $210.66, remaining below key moving averages (MA-20: $216.76, MA-50: $227.21, MA-200: $224.26), indicating seller dominance across all timeframes.
- Daily momentum is mixed: MACD signals a strong sell, RSI is subdued at 42.39, while intraday flows show buying strength near session highs amid moderate volatility.
- Short-term support sits at $207.89 (MA-5), resistance at $221.89 (Ichimoku Kijun); baseline outlook expects a sideways range between $208 and $215 over the next five days.
AI acquisitions and major deals counter weak earnings for sentiment this week
Amazon acquired the AI firm Vercept, which will now fully integrate and discontinue its external products, signaling a push to advance artificial intelligence capabilities. Amazon Web Services expanded capacity through new agreements with OpenAI, Visa, BlackRock, and the NBA to boost its AI-related offerings. The company also reported about $717 billion in sales for 2025, making Amazon the top global revenue generator despite recent earnings missing analyst expectations and volatility related to capital expenditures.
Key technical weakness prevails over the week as momentum stalls
Technical analysis on the weekly (W1) timeframe signals continued weakness: AMZN ended the week below the MA-20, MA-50, and MA-200, confirming active downward trends across short-, medium-, and long-term timeframes. Weekly support is now situated near $208, while resistance is set at $215 and higher at $221.89, derived from key moving averages and weekly candle levels. The RSI (W1) sits near 42, hovering close to oversold, and other weekly indicators point toward diminished momentum and a lack of immediate reversal signals.
Neutral-to-negative outlook next week given range-bound risk and muted momentum
For the coming week, AMZN is likely to trade within a sideways band between $208 and $215, reflecting ongoing volatility and the absence of bullish momentum on W1 indicators. The probability of a sustained upward move above resistance ($221.89) is low unless renewed buying forces emerge; conversely, a breakdown below support at $208 could trigger further downside. Near-term bias remains neutral to mildly negative unless key resistance is reclaimed on a weekly close.
Previously it was reported that Amazon.com, Inc. shares remain under persistent downward pressure, trading below key short-, medium-, and long-term moving averages, with daily momentum indicators such as MACD and ADX maintaining a bearish bias. Oscillator readings including RSI and CCI suggest mild oversold conditions, while resistance is tracked near $222 and short-term support is less clearly defined below current levels.


-
 Afghanistan
-
 Albania
-
 Algeria
-
 Angola
-
 Argentina
-
 Armenia
-
 Australia
-
 Austria
-
 Azerbaijan
-
 Bahamas
-
 Bahrain
-
 Bangladesh
-
 Belarus
-
 Belgium
-
 Bolivia
-
 Botswana
-
 Brazil
-
 Brunei
-
 Bulgaria
-
 Cambodia
-
 Cameroon
-
 Canada
-
 Chile
Chile
-
 China
China
-
 Colombia
-
 Congo
Congo
-
 Costa Rica
-
 Cote d'Ivoire
-
 Croatia
-
 Cuba
Cuba
-
 Cyprus
-
 Czechia
-
 DR Congo
-
 Denmark
-
 Dominican Republic
-
 Ecuador
-
 Egypt
Egypt
-
 El Salvador
-
 Estonia
-
 Eswatini
-
 Ethiopia
-
 Finland
-
 France
-
 Georgia
-
 Germany
-
 Ghana
Ghana
-
 Greece
-
 Haiti
Haiti
-
 Hong Kong
-
 Hungary
-
 India
India
-
 Indonesia
-
 Iran, Islamic republic
-
 Iraq
Iraq
-
 Ireland
-
 Israel
-
 Italy
Italy
-
 Jamaica
-
 Japan
Japan
-
 Jordan
-
 Kazakhstan
-
 Kenya
Kenya
-
 Korea
Korea
-
 Kuwait
-
 Kyrgyzstan
-
 Laos
Laos
-
 Latvia
-
 Lebanon
-
 Lesotho
-
 Libya
Libya
-
 Lithuania
-
 Luxembourg
-
 Madagascar
-
 Malaysia
-
 Malta
Malta
-
 Mauritius
-
 Mexico
-
 Moldova
-
 Mongolia
-
 Montenegro
-
 Morocco
-
 Mozambique
-
 Myanmar
-
 Namibia
-
 Nepal
Nepal
-
 Netherlands
-
 New Zealand
-
 Nigeria
-
 North Macedonia
-
 Norway
-
 Oman
Oman
-
 Pakistan
-
 Palestine
-
 Panama
-
 Papua New Guinea
-
 Paraguay
-
 Peru
Peru
-
 Philippines
-
 Poland
-
 Portugal
-
 Puerto Rico
-
 Qatar
Qatar
-
 Reunion
-
 Romania
-
 Rwanda
-
 Saudi Arabia
-
 Serbia
-
 Singapore
-
 Slovakia
-
 Slovenia
-
 Somalia
-
 South Africa
-
 Spain
Spain
-
 Sri Lanka
-
 Sweden
-
 Switzerland
-
 Syria
Syria
-
 Taiwan
-
 Tajikistan
-
 Tanzania
-
 Thailand
-
 Trinidad and Tobago
-
 Tunisia
-
 Turkey
-
 UAE
UAE
-
 Uganda
-
 Ukraine
-
 United Kingdom
-
United States
-
 Uruguay
-
 Uzbekistan
-
 Venezuela
-
 Vietnam
-
 Yemen
Yemen
-
 Zambia
-
 Zimbabwe
- Forex
- Crypto
