
Canopy Growth stock: Weak MACD and overbought oscillators drive further losses

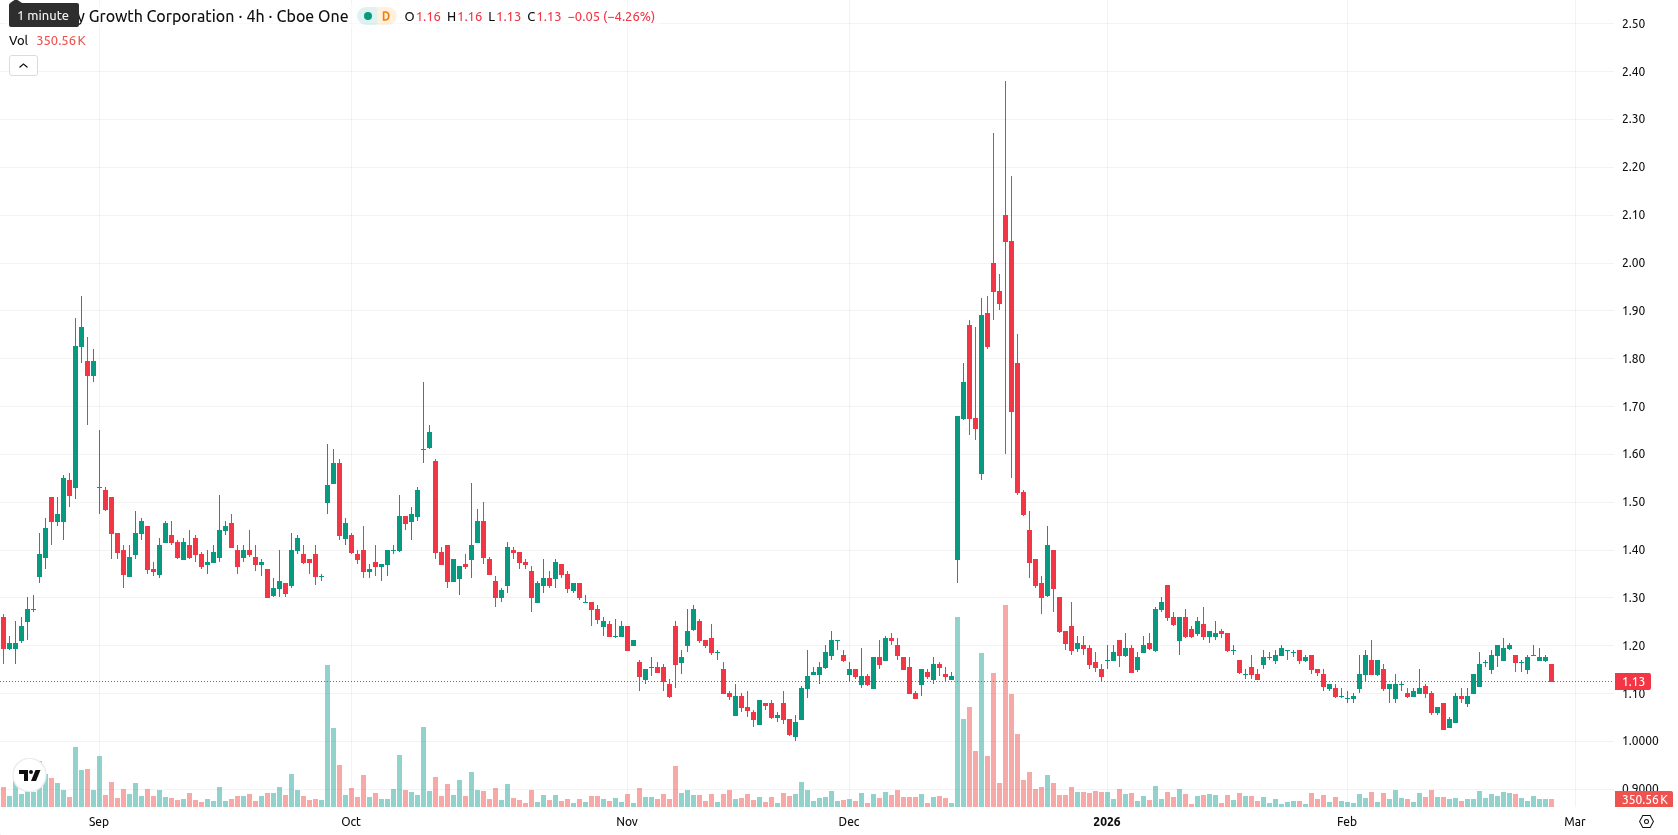
Canopy Growth Corporation (CGC) is trading at $1.13, down 3.43% on the day. The price sits just above the MA-20 ($1.12) but remains well below the MA-50 ($1.24) and MA-200 ($1.30), suggesting short-term stability while medium- and long-term bearish trends persist.
Highlights
- Canopy Growth shares trade at $1.13, just above the MA-20 ($1.12), but remain below the MA-50 ($1.24) and MA-200 ($1.30), signaling ongoing medium- and long-term bearish pressure.
- Daily and weekly MACD provide strong sell signals, with momentum indicators overall weak and bearish bias reinforced by the stock's 3.43% drop and low intraday volatility.
- Key technical levels are immediate resistance at $1.12 and firm support at $1.11, with probability of a price increase below 20% over the next five sessions.
Bearish momentum persists as indicators flash weak trend and exhaustion
On the technical side, the Ichimoku Kijun at $1.12 acts as immediate resistance. MACD signals a strong sell bias across daily and weekly intervals, and both daily (6.21) and weekly (19.68) ADX readings indicate a weak trend. RSI (52.53) and CCI (99.27) hint at mild buying interest, but the Stochastic RSI at 86.51 is overbought, suggesting potential exhaustion. Bull/Bear Power points to slight buyer dominance, but with today’s price near the session low ($1.12–$1.16) and a negative daily move following a small gap down, the prevailing momentum remains bearish.
Tight trading range expected as upside risk stays limited
For the next five trading days, the expected volatility band is $1.11 to $1.14, with price action likely staying close to current levels. Chances of upside movement are very low (below 20%), as dominant weekly MACD, RSI, and moving averages continue to indicate selling pressure. The base scenario anticipates a narrow sideways move. A bullish turn requires a breakout above $1.12 and a sustained move above $1.14, while a breach below $1.11 could trigger further downside for CGC.
Last time, analysts noted that Canopy Growth Corporation maintained short-term support just above its 20-day moving average, but remained constrained by medium- and long-term resistance at higher moving averages, with mixed momentum and trend signals. Oscillators such as RSI and CCI showed mild bullish bias while the MACD and ADX reflected prevailing bearish sentiment, suggesting the stock continues to consolidate within a narrow range between immediate support and resistance levels.


Latest Canopy Growth News


-
 Afghanistan
-
 Albania
-
 Algeria
-
 Angola
-
 Argentina
-
 Armenia
-
 Australia
-
 Austria
-
 Azerbaijan
-
 Bahamas
-
 Bahrain
-
 Bangladesh
-
 Belarus
-
 Belgium
-
 Bolivia
-
 Botswana
-
 Brazil
-
 Brunei
-
 Bulgaria
-
 Cambodia
-
 Cameroon
-
 Canada
-
 Chile
Chile
-
 China
China
-
 Colombia
-
 Congo
Congo
-
 Costa Rica
-
 Cote d'Ivoire
-
 Croatia
-
 Cuba
Cuba
-
 Cyprus
-
 Czechia
-
 DR Congo
-
 Denmark
-
 Dominican Republic
-
 Ecuador
-
 Egypt
Egypt
-
 El Salvador
-
 Estonia
-
 Eswatini
-
 Ethiopia
-
 Finland
-
 France
-
 Georgia
-
 Germany
-
 Ghana
Ghana
-
 Greece
-
 Haiti
Haiti
-
 Hong Kong
-
 Hungary
-
 India
India
-
 Indonesia
-
 Iran, Islamic republic
-
 Iraq
Iraq
-
 Ireland
-
 Israel
-
 Italy
Italy
-
 Jamaica
-
 Japan
Japan
-
 Jordan
-
 Kazakhstan
-
 Kenya
Kenya
-
 Korea
Korea
-
 Kuwait
-
 Kyrgyzstan
-
 Laos
Laos
-
 Latvia
-
 Lebanon
-
 Lesotho
-
 Libya
Libya
-
 Lithuania
-
 Luxembourg
-
 Madagascar
-
 Malaysia
-
 Malta
Malta
-
 Mauritius
-
 Mexico
-
 Moldova
-
 Mongolia
-
 Montenegro
-
 Morocco
-
 Mozambique
-
 Myanmar
-
 Namibia
-
 Nepal
Nepal
-
 Netherlands
-
 New Zealand
-
 Nigeria
-
 North Macedonia
-
 Norway
-
 Oman
Oman
-
 Pakistan
-
 Palestine
-
 Panama
-
 Papua New Guinea
-
 Paraguay
-
 Peru
Peru
-
 Philippines
-
 Poland
-
 Portugal
-
 Puerto Rico
-
 Qatar
Qatar
-
 Reunion
-
 Romania
-
 Rwanda
-
 Saudi Arabia
-
 Serbia
-
 Singapore
-
 Slovakia
-
 Slovenia
-
 Somalia
-
 South Africa
-
 Spain
Spain
-
 Sri Lanka
-
 Sweden
-
 Switzerland
-
 Syria
Syria
-
 Taiwan
-
 Tajikistan
-
 Tanzania
-
 Thailand
-
 Trinidad and Tobago
-
 Tunisia
-
 Turkey
-
 UAE
UAE
-
 Uganda
-
 Ukraine
-
 United Kingdom
-
United States
-
 Uruguay
-
 Uzbekistan
-
 Venezuela
-
 Vietnam
-
 Yemen
Yemen
-
 Zambia
-
 Zimbabwe
- Forex
- Crypto
