
Microsoft stock price forecast: Regulatory review and technical hurdles as MSFT trades lower

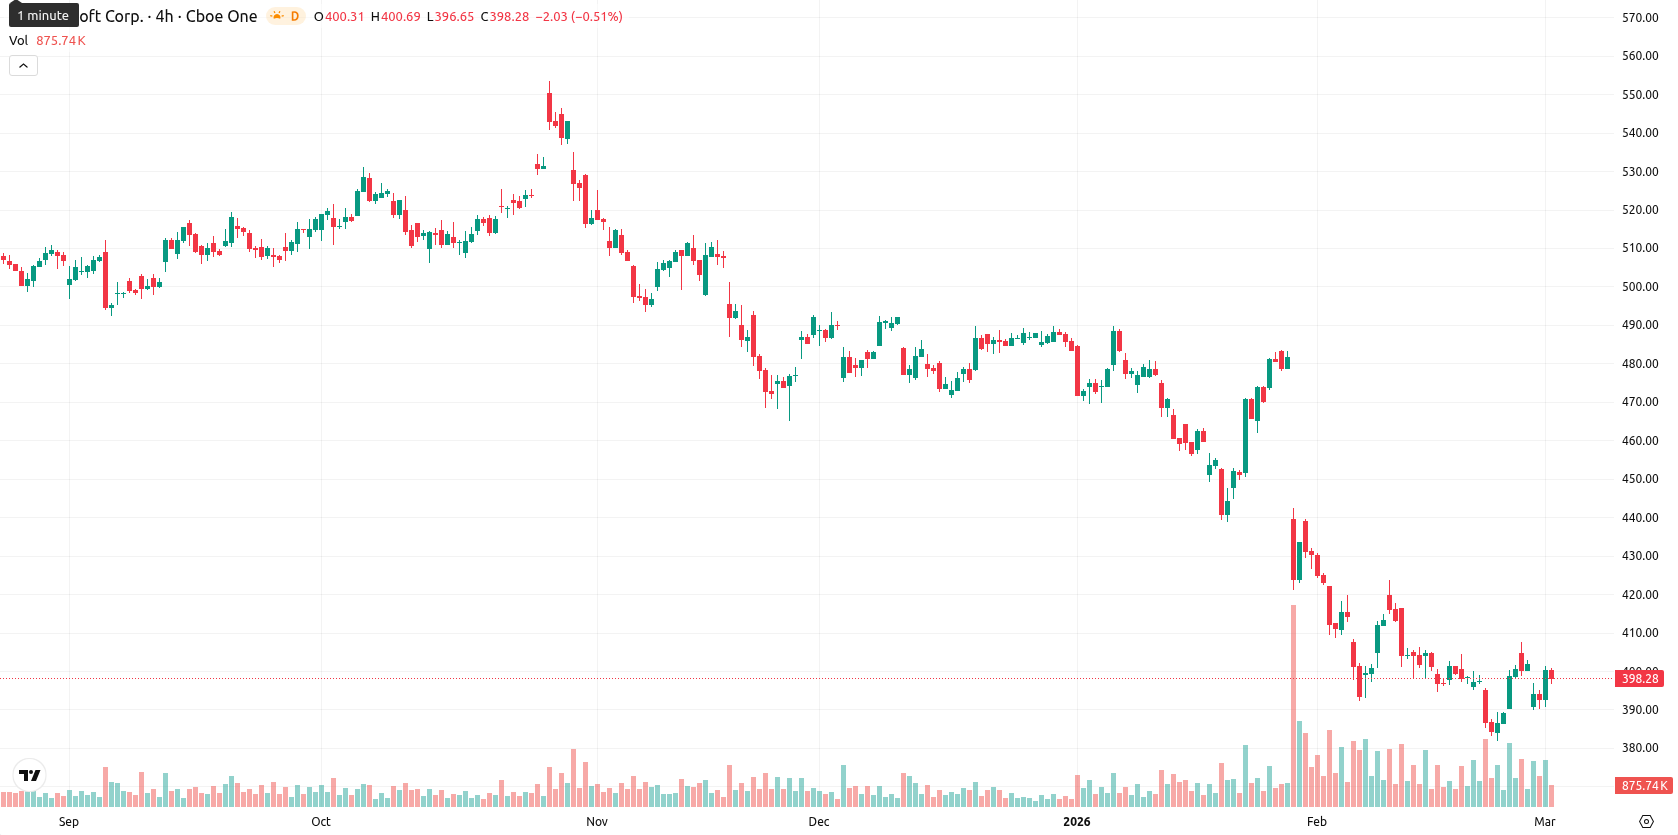
Microsoft Corporation (MSFT) is trading at $395.92, down 0.72% on the day. The share remains below its MA-20 ($401.88), MA-50 ($443.79), and MA-200 ($485.50), highlighting continued seller pressure across all observed timeframes.
Highlights
- Microsoft is under U.S. Federal Trade Commission review for AI sector acquisitions and licensing, following its 2023 purchase of Activision Blizzard and leadership changes.
- Annual capital expenditures rose to a historic $150 billion amid expanded investments in AI infrastructure and continued partnerships with OpenAI, facing intensified competition from Meta and Google.
- Microsoft shares remain under sustained technical pressure, trading at $395.92 below key moving averages, with $432.73 as immediate resistance and downside risk toward $372.
Regulatory scrutiny and AI spending intensify as rivals escalate competition
Microsoft is under regulatory review by the U.S. Federal Trade Commission concerning acquisitions and licensing practices in the AI sector. The recent acquisition of Activision Blizzard in 2023 led to a leadership restructure, with Asha Sharma appointed as CEO of Microsoft Gaming effective February 2026. Significant capital investments in AI infrastructure and an ongoing partnership with OpenAI were reported, alongside intensified competition from Meta and Google. The period was also marked by historically high annual capital expenditures of approximately $150 billion, though price action has remained under broader selling pressure.
Technical resistance and momentum weakness coincide with intraday volatility
At $395.92, MSFT remains below the MA-20 ($401.88), MA-50 ($443.79), and MA-200 ($485.50), signaling persistent seller pressure across all time horizons. The Ichimoku Kijun at $432.73 stands above the current price and should be regarded as immediate resistance. Momentum indicators on the daily chart point to continued weakness: the MACD gives a strong sell signal, while the ADX confirms a prevailing downtrend. The RSI sits near 40 and leans bearish, with the Stochastic RSI at overbought extremes, and the Commodity Channel Index remains neutral; this mix suggests a divergence between momentum loss and an overextended bounce attempt. Bull/Bear Power points to oversold conditions, indicating seller dominance intraday. Today, trading opened with a moderate gap down from $398.78 to $392.98, and the current price sits in the middle of today’s $390.84 – $401.15 range, reflecting moderate volatility and signs of sluggish consolidation after the initial pressure.
Sideways trading favored as downside risk outweighs bullish reversal
For the next five trading days, the expected range is between $372 and $416, centered around the current price and reflecting typical blue-chip volatility. There is a very low probability (less than 20%) of a significant price increase. A decline remains more likely, with multiple weekly and daily indicators in alignment. The baseline scenario points to sideways action within this corridor as sellers and buyers contend for direction, with bullish reversal potential above $432.73 or further downside risk if $372 is breached.
Previously it was reported that Microsoft Corporation is trading below its key moving averages with persistent bearish momentum confirmed by technical indicators including MACD, ADX, and a low RSI. Despite a recent 2.06% uptick, the stock faces resistance near the Ichimoku Kijun, support around the $400 level, and continued oversold signals, casting doubt on the strength of any immediate rebound.


Latest Microsoft News


-
 Afghanistan
-
 Albania
-
 Algeria
-
 Angola
-
 Argentina
-
 Armenia
-
 Australia
-
 Austria
-
 Azerbaijan
-
 Bahamas
-
 Bahrain
-
 Bangladesh
-
 Belarus
-
 Belgium
-
 Bolivia
-
 Botswana
-
 Brazil
-
 Brunei
-
 Bulgaria
-
 Cambodia
-
 Cameroon
-
 Canada
-
 Chile
Chile
-
 China
China
-
 Colombia
-
 Congo
Congo
-
 Costa Rica
-
 Cote d'Ivoire
-
 Croatia
-
 Cuba
Cuba
-
 Cyprus
-
 Czechia
-
 DR Congo
-
 Denmark
-
 Dominican Republic
-
 Ecuador
-
 Egypt
Egypt
-
 El Salvador
-
 Estonia
-
 Eswatini
-
 Ethiopia
-
 Finland
-
 France
-
 Georgia
-
 Germany
-
 Ghana
Ghana
-
 Greece
-
 Haiti
Haiti
-
 Hong Kong
-
 Hungary
-
 India
India
-
 Indonesia
-
 Iran, Islamic republic
-
 Iraq
Iraq
-
 Ireland
-
 Israel
-
 Italy
Italy
-
 Jamaica
-
 Japan
Japan
-
 Jordan
-
 Kazakhstan
-
 Kenya
Kenya
-
 Korea
Korea
-
 Kuwait
-
 Kyrgyzstan
-
 Laos
Laos
-
 Latvia
-
 Lebanon
-
 Lesotho
-
 Libya
Libya
-
 Lithuania
-
 Luxembourg
-
 Madagascar
-
 Malaysia
-
 Malta
Malta
-
 Mauritius
-
 Mexico
-
 Moldova
-
 Mongolia
-
 Montenegro
-
 Morocco
-
 Mozambique
-
 Myanmar
-
 Namibia
-
 Nepal
Nepal
-
 Netherlands
-
 New Zealand
-
 Nigeria
-
 North Macedonia
-
 Norway
-
 Oman
Oman
-
 Pakistan
-
 Palestine
-
 Panama
-
 Papua New Guinea
-
 Paraguay
-
 Peru
Peru
-
 Philippines
-
 Poland
-
 Portugal
-
 Puerto Rico
-
 Qatar
Qatar
-
 Reunion
-
 Romania
-
 Rwanda
-
 Saudi Arabia
-
 Serbia
-
 Singapore
-
 Slovakia
-
 Slovenia
-
 Somalia
-
 South Africa
-
 Spain
Spain
-
 Sri Lanka
-
 Sweden
-
 Switzerland
-
 Syria
Syria
-
 Taiwan
-
 Tajikistan
-
 Tanzania
-
 Thailand
-
 Trinidad and Tobago
-
 Tunisia
-
 Turkey
-
 UAE
UAE
-
 Uganda
-
 Ukraine
-
 United Kingdom
-
United States
-
 Uruguay
-
 Uzbekistan
-
 Venezuela
-
 Vietnam
-
 Yemen
Yemen
-
 Zambia
-
 Zimbabwe
- Forex
- Crypto
