
-0.84% for Microsoft stock — Downward pressure follows robust Azure contract gains

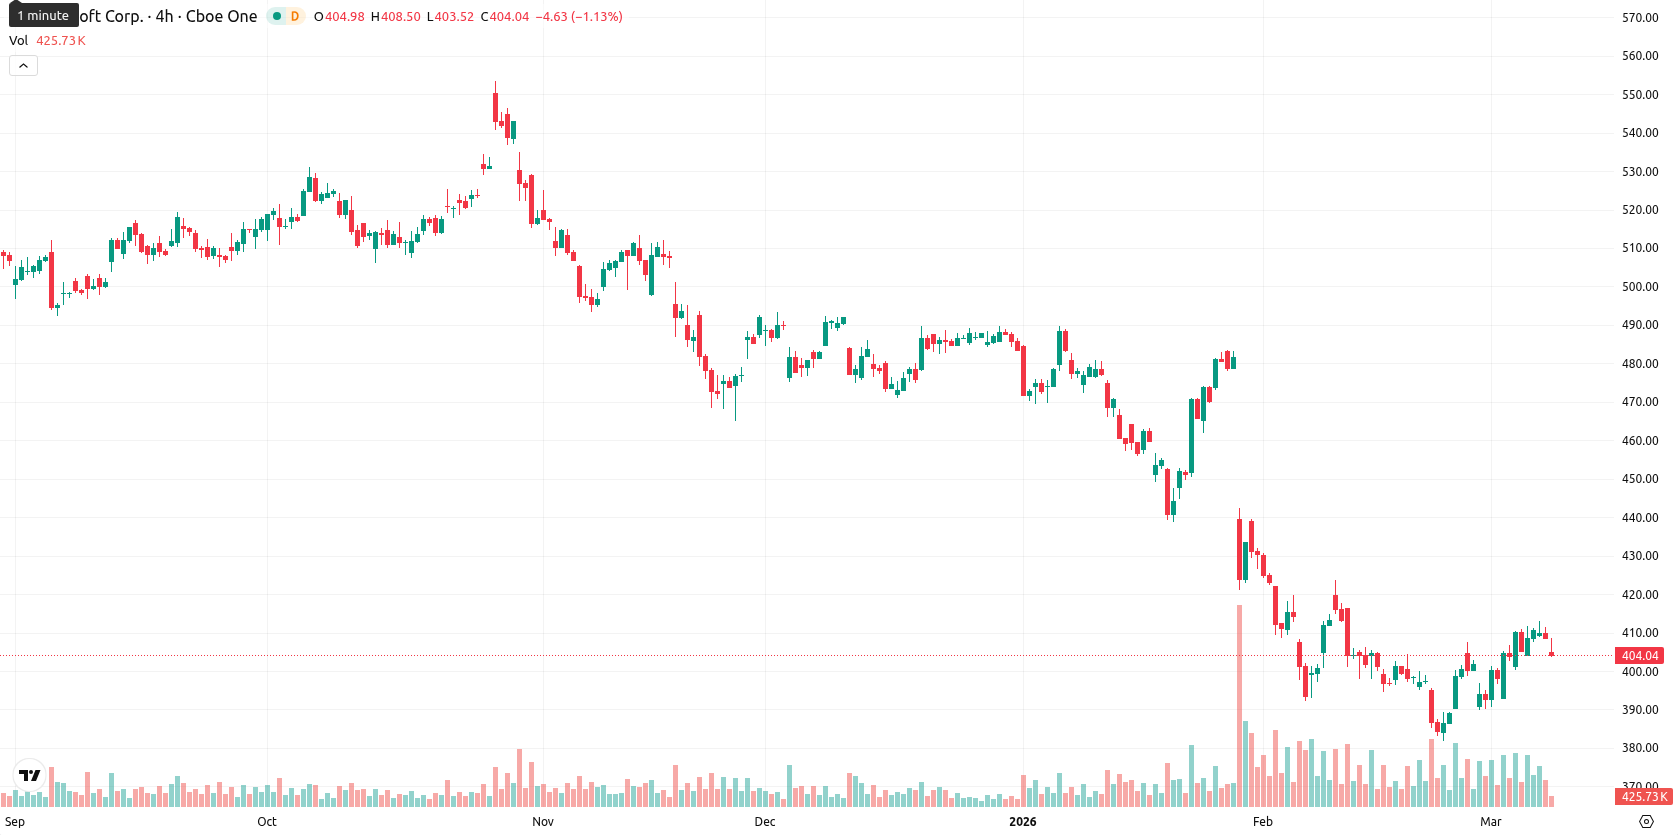
Microsoft Corporation (MSFT) is trading at $405.35 after a daily move of -0.84%. Shares are positioned above the MA-20 at $401.18, signaling short-term support, but the price remains well below both the MA-50 at $437.75 and the MA-200 at $484.54, confirming ongoing medium- and long-term bearish pressure. The immediate resistance is provided by the Ichimoku Kijun level at $412.11.
Highlights
- Microsoft delivered 17% revenue growth and robust Azure-driven commercial bookings, with $625 billion in obligations, 45% tied to OpenAI collaboration.
- Shareholder returns remained in focus with $12.7 billion distributed via dividends and buybacks, despite market-wide selling pressure.
- Technical signals indicate sellers remain dominant, with a $401–$414.50 range expected and downside risk outweighing short-term upside.
Commercial growth muted by persistent selling after OpenAI-linked gains
Microsoft recently reported 17% revenue growth and a 230% increase in commercial bookings linked to large Azure contracts. The company’s commercial performance obligations have reached approximately $625 billion, with about 45% related to its partnership with OpenAI. Shareholder returns were prioritized as $12.7 billion was distributed through dividends and buybacks, and a Secure Boot Allowed Key Exchange Key update was rolled out for Windows 11, though price action has remained under broader selling pressure.
Seller dominance extends as momentum signals diverge and exhaust
Momentum indicators on the daily chart are mostly negative, with the MACD in a strong sell position and the ADX confirming that sellers are in control. The RSI is at 47.20 and signals a sell bias, while the Commodity Channel Index and Bull/Bear Power also indicate overbought conditions and continued seller dominance. The Stochastic RSI shows an overbought reading, highlighting divergences among oscillators and suggesting possible exhaustion in the short term. The session opened just below the previous close, with the price near the lower end of today’s range after declining 0.84%, indicating volatile action with persistent downside pressure.
Further losses likely if $401 breached amid low upside odds
For the next five trading days, MSFT is expected to trade between $401.00 and $414.50, reflecting a volatility band relative to current levels. The probability of a price increase remains low, estimated below 20%, given the persistent sell signals on the daily and weekly charts. A move above the $412.11 resistance may fuel short-term buying momentum toward the upper range. Continued downside is likely if the price breaks and holds below $401.00, opening the path for further near-term losses.
Previously it was reported that Microsoft Corporation is trading above its short-term 20-day moving average but remains below the 50- and 200-day levels, indicating ongoing resistance despite near-term momentum. Technical indicators present a mixed outlook, with MACD signaling downside, RSI and CCI showing neutrality, and immediate resistance observed around $432–$440, suggesting anticipated sideways movement within a defined range amid moderate volatility and low probability of a sustained upside breakout.


Latest Microsoft News


-
 Afghanistan
-
 Albania
-
 Algeria
-
 Angola
-
 Argentina
-
 Armenia
-
 Australia
-
 Austria
-
 Azerbaijan
-
 Bahamas
-
 Bahrain
-
 Bangladesh
-
 Belarus
-
 Belgium
-
 Bolivia
-
 Botswana
-
 Brazil
-
 Brunei
-
 Bulgaria
-
 Cambodia
-
 Cameroon
-
 Canada
-
 Chile
Chile
-
 China
China
-
 Colombia
-
 Congo
Congo
-
 Costa Rica
-
 Cote d'Ivoire
-
 Croatia
-
 Cuba
Cuba
-
 Cyprus
-
 Czechia
-
 DR Congo
-
 Denmark
-
 Dominican Republic
-
 Ecuador
-
 Egypt
Egypt
-
 El Salvador
-
 Estonia
-
 Eswatini
-
 Ethiopia
-
 Finland
-
 France
-
 Georgia
-
 Germany
-
 Ghana
Ghana
-
 Greece
-
 Haiti
Haiti
-
 Hong Kong
-
 Hungary
-
 India
India
-
 Indonesia
-
 Iran, Islamic republic
-
 Iraq
Iraq
-
 Ireland
-
 Israel
-
 Italy
Italy
-
 Jamaica
-
 Japan
Japan
-
 Jordan
-
 Kazakhstan
-
 Kenya
Kenya
-
 Korea
Korea
-
 Kuwait
-
 Kyrgyzstan
-
 Laos
Laos
-
 Latvia
-
 Lebanon
-
 Lesotho
-
 Libya
Libya
-
 Lithuania
-
 Luxembourg
-
 Madagascar
-
 Malaysia
-
 Malta
Malta
-
 Mauritius
-
 Mexico
-
 Moldova
-
 Mongolia
-
 Montenegro
-
 Morocco
-
 Mozambique
-
 Myanmar
-
 Namibia
-
 Nepal
Nepal
-
 Netherlands
-
 New Zealand
-
 Nigeria
-
 North Macedonia
-
 Norway
-
 Oman
Oman
-
 Pakistan
-
 Palestine
-
 Panama
-
 Papua New Guinea
-
 Paraguay
-
 Peru
Peru
-
 Philippines
-
 Poland
-
 Portugal
-
 Puerto Rico
-
 Qatar
Qatar
-
 Reunion
-
 Romania
-
 Rwanda
-
 Saudi Arabia
-
 Serbia
-
 Singapore
-
 Slovakia
-
 Slovenia
-
 Somalia
-
 South Africa
-
 Spain
Spain
-
 Sri Lanka
-
 Sweden
-
 Switzerland
-
 Syria
Syria
-
 Taiwan
-
 Tajikistan
-
 Tanzania
-
 Thailand
-
 Trinidad and Tobago
-
 Tunisia
-
 Turkey
-
 UAE
UAE
-
 Uganda
-
 Ukraine
-
 United Kingdom
-
United States
-
 Uruguay
-
 Uzbekistan
-
 Venezuela
-
 Vietnam
-
 Yemen
Yemen
-
 Zambia
-
 Zimbabwe
- Forex
- Crypto
