
Microsoft stock shows mixed momentum as MACD signals strong sell: weekly forecast

Microsoft Corporation (MSFT) is currently trading at $393.44 after rising $8.37 (2.17%) over the past week. The price remains below the weekly MA-20 ($399.15) and well under the MA-50 ($449.25), but still above the MA-200 ($389.14), indicating moderate medium-term selling pressure, with longer-term support from the MA-200.
 395.96
405.99
395.96
405.99
Highlights
- Microsoft faces moderate medium-term selling pressure as it trades below key moving averages, despite support from the long-term trend.
- Momentum signals are decisively bearish, with no major indicators pointing to a buy or strong buy scenario.
- MSFT is expected to consolidate sideways between $385 and $400, with a low probability of a significant upside breakout next week.
Earnings anticipation and AI partnership as legal headwinds persist this week
Microsoft is set to report its fiscal Q4 2026 earnings on July 29. The company confirmed a multi-year partnership with 3M to enhance AI data center infrastructure, with Azure becoming the first major cloud provider to adopt 3M's Expanded Beam Optical technology. Microsoft's ongoing legal challenges include several securities class action lawsuits from shareholders concerning the performance and reporting of Copilot AI products and Azure cloud services.
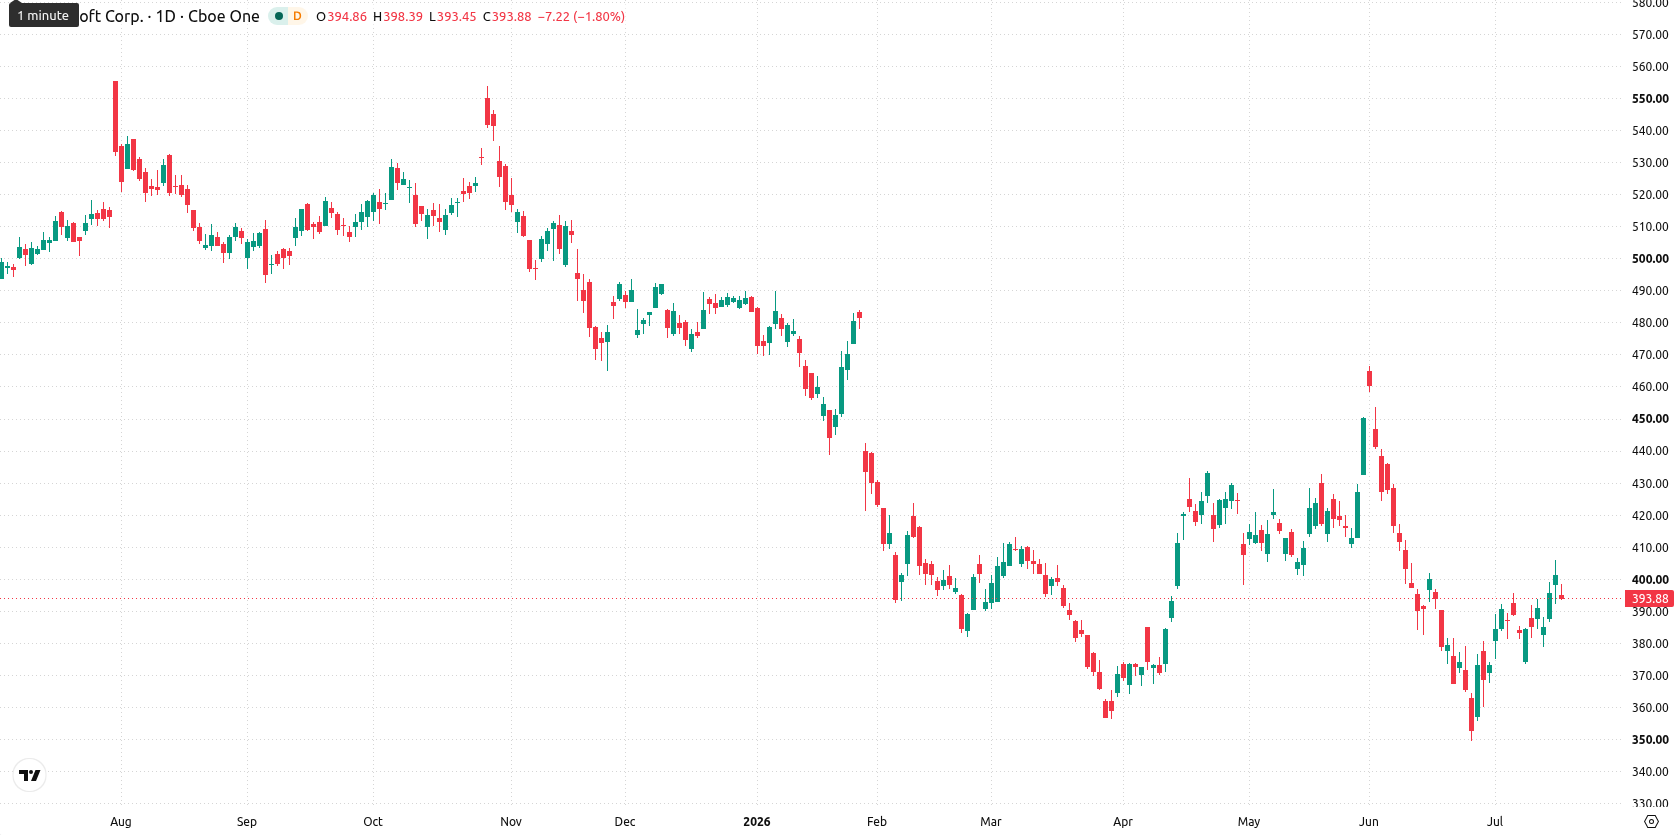
Persistent bearish momentum as MSFT tests resistance below key averages
Weekly technical signals maintain a bearish bias for MSFT, with both MACD (Strong Sell) and ADX (Sell, trend value 21.33) indicating continued downside risk. The asset trades below its MA-20 and MA-50, which now act as dynamic resistance, but remains supported by the MA-200. Weekly support lies at $385, while resistance is seen at $400 and the MA-20. Oscillators offer mixed readings, as RSI (46.72, Sell) and CCI (-8.96, Neutral) do not point to oversold levels, and Stochastic RSI hovers near neutral, suggesting weak reversal momentum. Bull/Bear Power flags overbought conditions, reflecting buyers recently dominating but possibly losing traction.
Range-bound outlook expected as upside capped by weak bullish signals
In the coming five trading days, MSFT is expected to consolidate broadly between $385 and $400, aligning with the current choppy tone and lack of clear trend reversal on the weekly chart. Upside potential is limited, with a less than 20% chance of a significant break higher, as none of the key weekly indicators signal a strong buy. A move above $400 would be required for a bullish scenario, targeting a return toward the weekly MA-20, while a close below $385 could open the way for renewed downside toward prior lows.
Earlier, analysts noted that Microsoft’s long-term outlook remained constructive, supported by ongoing enterprise AI adoption and the company’s strategic cloud initiatives. However, with technical indicators now signaling persistent downside risk and legal challenges adding uncertainty, investors should closely monitor the $385 weekly support level as a potential inflection point in the coming sessions.


Latest Microsoft News





-
 Afghanistan
-
 Albania
-
 Algeria
-
 Angola
-
 Argentina
-
 Armenia
-
 Australia
-
 Austria
-
 Azerbaijan
-
 Bahamas
-
 Bahrain
-
 Bangladesh
-
 Belarus
-
 Belgium
-
 Bolivia
-
 Botswana
-
 Brazil
-
 Brunei
-
 Bulgaria
-
 Cambodia
-
 Cameroon
-
 Canada
-
 Chile
Chile
-
 China
China
-
 Colombia
-
 Congo
Congo
-
 Costa Rica
-
 Cote d'Ivoire
-
 Croatia
-
 Cuba
Cuba
-
 Cyprus
-
 Czechia
-
 DR Congo
-
 Denmark
-
 Dominican Republic
-
 Ecuador
-
 Egypt
Egypt
-
 El Salvador
-
 Estonia
-
 Eswatini
-
 Ethiopia
-
 Finland
-
 France
-
 Georgia
-
 Germany
-
 Ghana
Ghana
-
 Greece
-
 Haiti
Haiti
-
 Hong Kong
-
 Hungary
-
 India
India
-
 Indonesia
-
 Iran, Islamic republic
-
 Iraq
Iraq
-
 Ireland
-
 Israel
-
 Italy
Italy
-
 Jamaica
-
 Japan
Japan
-
 Jordan
-
 Kazakhstan
-
 Kenya
Kenya
-
 Korea
Korea
-
 Kuwait
-
 Kyrgyzstan
-
 Laos
Laos
-
 Latvia
-
 Lebanon
-
 Lesotho
-
 Libya
Libya
-
 Lithuania
-
 Luxembourg
-
 Madagascar
-
 Malaysia
-
 Malta
Malta
-
 Mauritius
-
 Mexico
-
 Moldova
-
 Mongolia
-
 Montenegro
-
 Morocco
-
 Mozambique
-
 Myanmar
-
 Namibia
-
 Nepal
Nepal
-
 Netherlands
-
 New Zealand
-
 Nigeria
-
 North Macedonia
-
 Norway
-
 Oman
Oman
-
 Pakistan
-
 Palestine
-
 Panama
-
 Papua New Guinea
-
 Paraguay
-
 Peru
Peru
-
 Philippines
-
 Poland
-
 Portugal
-
 Puerto Rico
-
 Qatar
Qatar
-
 Reunion
-
 Romania
-
 Rwanda
-
 Saudi Arabia
-
 Serbia
-
 Singapore
-
 Slovakia
-
 Slovenia
-
 Somalia
-
 South Africa
-
 Spain
Spain
-
 Sri Lanka
-
 Sweden
-
 Switzerland
-
 Syria
Syria
-
 Taiwan
-
 Tajikistan
-
 Tanzania
-
 Thailand
-
 Trinidad and Tobago
-
 Tunisia
-
 Turkey
-
 UAE
UAE
-
 Uganda
-
 Ukraine
-
 United Kingdom
-
United States
-
 Uruguay
-
 Uzbekistan
-
 Venezuela
-
 Vietnam
-
 Yemen
Yemen
-
 Zambia
-
 Zimbabwe
- Forex
- Crypto











