
AMD stock rallies 6.4% amid oversold technical readings on key oscillators – weekly analysis

Advanced Micro Devices, Inc. (AMD) is trading at $204.34, finishing the week up $11.90 or 6.4% from the open of $192.44. The price closed below the weekly MA-20 ($219.02), but remains above the MA-50 ($174.80) and well above the MA-200 ($131.98), reflecting short-term resistance but a still-strong broader trend.
Highlights
- AMD faces short-term resistance and current seller pressure but retains a strong medium- and long-term bullish technical structure.
- Technical indicators are mixed, with momentum mostly negative and oscillators showing oversold conditions, reflecting weak trend conviction for the week.
- Baseline forecast projects AMD consolidating between $189.00 and $215.00, with volatility elevated and downside risk outweighing immediate breakout potential.
Mixed signals emerge as momentum diverges during the week
Weekly technicals signal mixed momentum for AMD. The MACD provides a strong buy signal, yet the Awesome Oscillator indicates strong selling pressure. ADX is neutral, while RSI, CCI, and Stochastic RSI point to oversold conditions, and the Bull/Bear Power confirms sellers dominated the weekly action. The price is at the top of the historical weekly range with volatility at 7.78%, but strong upside momentum is not confirmed by all indicators.
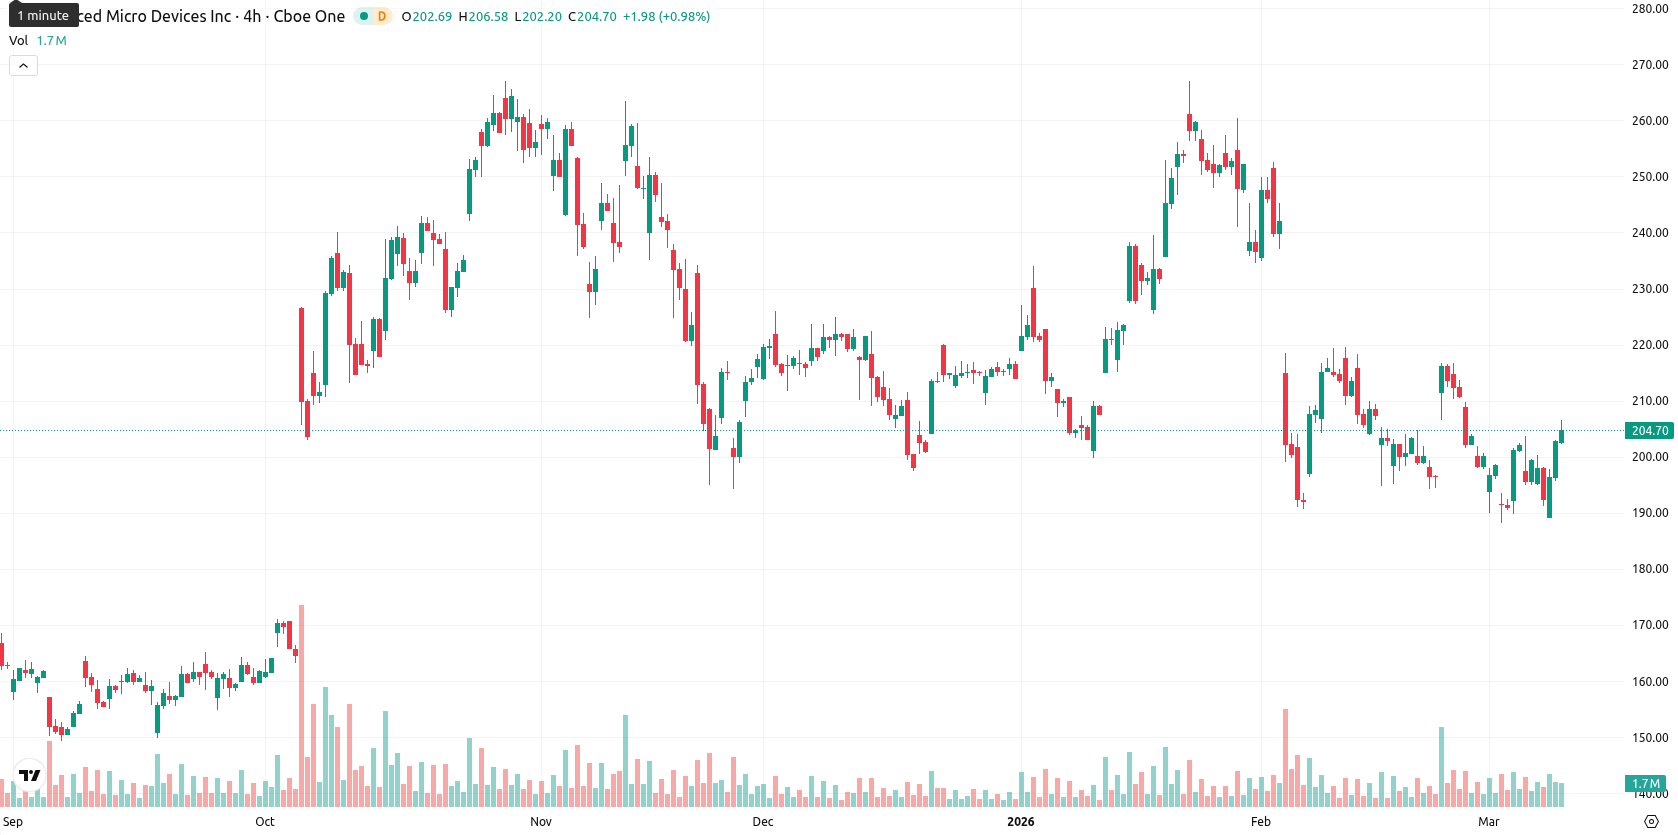
Consolidation favored as upside momentum remains unconfirmed for next week
Looking ahead, AMD is likely to consolidate in a wide band from $189.00 to $215.00 over the next week, as recent gains are digested. There is about a 25% chance of another leg higher, supported by only one of four major weekly momentum signals. The main scenario is a sideways move, while a break above $215.00 could open a push toward $218.00–$220.00. Conversely, a drop below $189.00 risks accelerating downside toward $180.00 if negative momentum persists.
Last time, analysts noted that Advanced Micro Devices, Inc. is trading above its short-term moving average but below medium-term resistance, with technical momentum mixed as MACD signals a strong sell and RSI remains neutral to weak. The asset faces immediate resistance near $220 while overbought indicators and tightening volatility suggest likely sideways consolidation between support around $195 and resistance at $215–$220.


-
 Afghanistan
-
 Albania
-
 Algeria
-
 Angola
-
 Argentina
-
 Armenia
-
 Australia
-
 Austria
-
 Azerbaijan
-
 Bahamas
-
 Bahrain
-
 Bangladesh
-
 Belarus
-
 Belgium
-
 Bolivia
-
 Botswana
-
 Brazil
-
 Brunei
-
 Bulgaria
-
 Cambodia
-
 Cameroon
-
 Canada
-
 Chile
Chile
-
 China
China
-
 Colombia
-
 Congo
Congo
-
 Costa Rica
-
 Cote d'Ivoire
-
 Croatia
-
 Cuba
Cuba
-
 Cyprus
-
 Czechia
-
 DR Congo
-
 Denmark
-
 Dominican Republic
-
 Ecuador
-
 Egypt
Egypt
-
 El Salvador
-
 Estonia
-
 Eswatini
-
 Ethiopia
-
 Finland
-
 France
-
 Georgia
-
 Germany
-
 Ghana
Ghana
-
 Greece
-
 Haiti
Haiti
-
 Hong Kong
-
 Hungary
-
 India
India
-
 Indonesia
-
 Iran, Islamic republic
-
 Iraq
Iraq
-
 Ireland
-
 Israel
-
 Italy
Italy
-
 Jamaica
-
 Japan
Japan
-
 Jordan
-
 Kazakhstan
-
 Kenya
Kenya
-
 Korea
Korea
-
 Kuwait
-
 Kyrgyzstan
-
 Laos
Laos
-
 Latvia
-
 Lebanon
-
 Lesotho
-
 Libya
Libya
-
 Lithuania
-
 Luxembourg
-
 Madagascar
-
 Malaysia
-
 Malta
Malta
-
 Mauritius
-
 Mexico
-
 Moldova
-
 Mongolia
-
 Montenegro
-
 Morocco
-
 Mozambique
-
 Myanmar
-
 Namibia
-
 Nepal
Nepal
-
 Netherlands
-
 New Zealand
-
 Nigeria
-
 North Macedonia
-
 Norway
-
 Oman
Oman
-
 Pakistan
-
 Palestine
-
 Panama
-
 Papua New Guinea
-
 Paraguay
-
 Peru
Peru
-
 Philippines
-
 Poland
-
 Portugal
-
 Puerto Rico
-
 Qatar
Qatar
-
 Reunion
-
 Romania
-
 Rwanda
-
 Saudi Arabia
-
 Serbia
-
 Singapore
-
 Slovakia
-
 Slovenia
-
 Somalia
-
 South Africa
-
 Spain
Spain
-
 Sri Lanka
-
 Sweden
-
 Switzerland
-
 Syria
Syria
-
 Taiwan
-
 Tajikistan
-
 Tanzania
-
 Thailand
-
 Trinidad and Tobago
-
 Tunisia
-
 Turkey
-
 UAE
UAE
-
 Uganda
-
 Ukraine
-
 United Kingdom
-
United States
-
 Uruguay
-
 Uzbekistan
-
 Venezuela
-
 Vietnam
-
 Yemen
Yemen
-
 Zambia
-
 Zimbabwe
- Forex
- Crypto
