
AMD stock price forecast: Resistance at $220.44 holds as AMD gains 1.26%

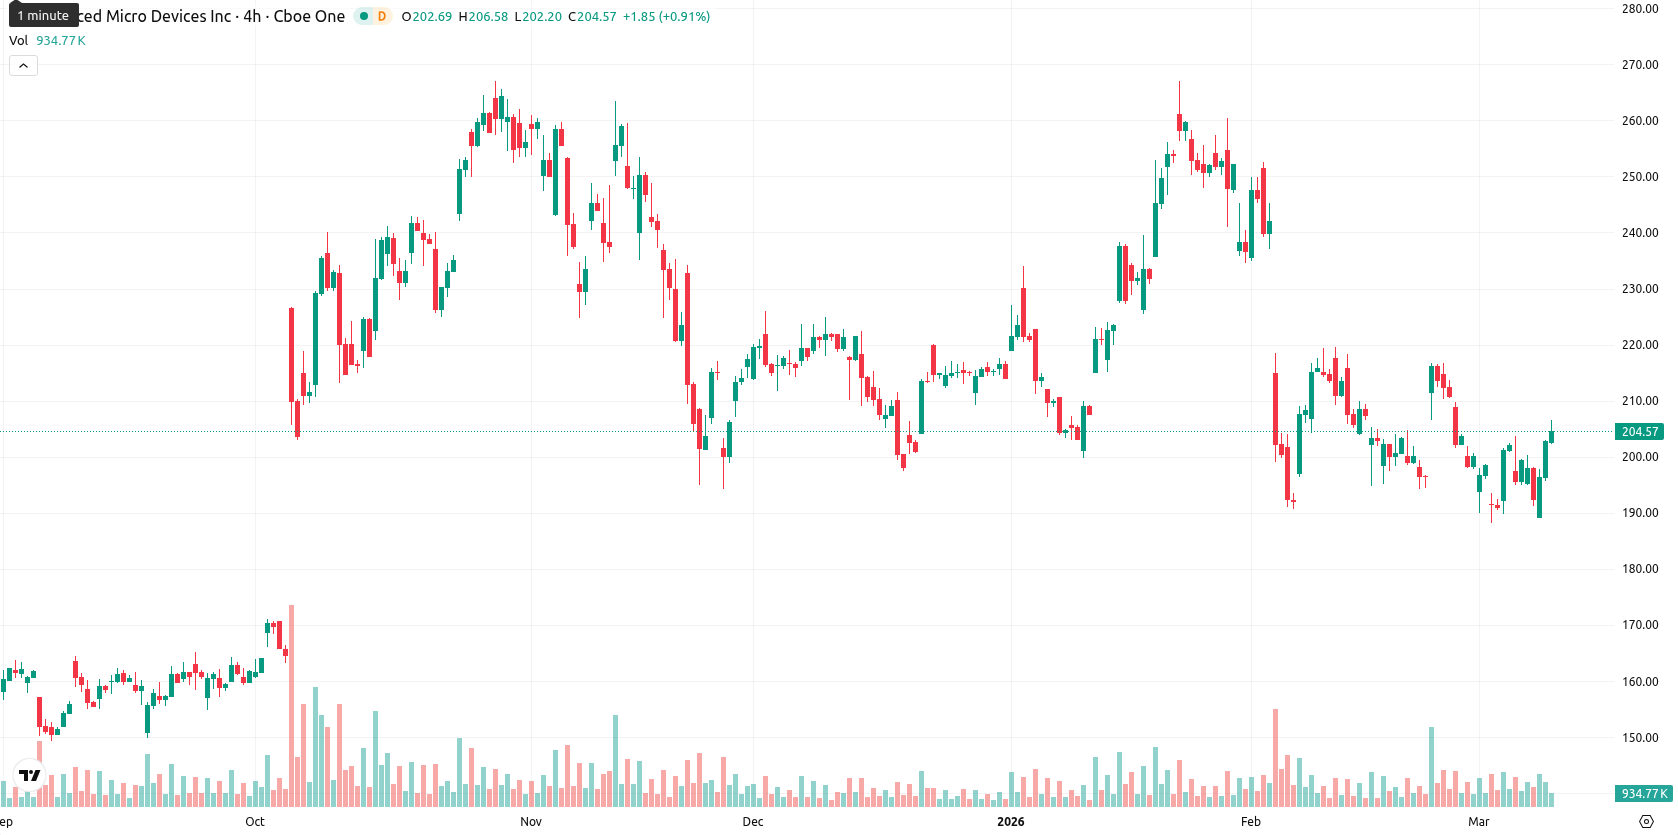
Advanced Micro Devices, Inc. (AMD) is trading at $205.20, posting a daily gain of 1.26%. The asset sits above its MA-20 of $203.72, below the MA-50 at $217.36, and is well above the MA-200 at $189.06, highlighting short-term buyer support, ongoing medium-term resistance, and a long-term bullish structure.
Highlights
- AMD spearheaded a $275 million investment in Xanadu Quantum Computing, demonstrating a strategic bet on quantum technology leadership.
- Xanadu achieved a 25x boost in aerospace simulation efficiency using hybrid quantum approaches, with the SEC approving its merger with Crane Harbor Acquisition Corp.
- AMD trades in a volatile consolidation band, with short-term buyer support, resistance at $220.44, and a forecasted $195–$215 range next week as momentum stays mixed.
Quantum investment and merger progress as AMD backs Xanadu
AMD has led a $275 million investment round in Xanadu Quantum Computing, marking a significant corporate action in quantum technology. The company achieved a 25x improvement in aerospace simulation efficiency using its hybrid technology. Additional backing comes from Crane Harbor Acquisition Corp., which added $225 million, with regulatory progress confirmed as the SEC approved a registration statement supporting Xanadu's planned merger with Crane Harbor.
Mixed momentum and overbought signals constrain upside amid resistance
Technical signals for AMD are mixed. Momentum shows the MACD on the daily chart as a strong sell, while the ADX at 15.8 remains neutral, indicating limited trend strength. Oscillators diverge: RSI at 46.98 is neutral to weak, both Stoch RSI and Bull/Bear Power (BBP) are overbought, and CCI suggests mild selling pressure, while the Awesome Oscillator (AO) is neutral. The Ichimoku Kijun sits at $220.44, presenting immediate resistance. Intraday, a moderate gap up was noted at the open ($204.47 versus the prior close of $202.64), with price action near the session's high, reflecting high volatility and buyer dominance, though overbought readings warn of possible exhaustion.
Sideways consolidation likely as resistance and support tighten
Over the coming week, typical volatility places AMD within a $195.00 – $215.00 band. The probability of further upward movement is around 50%, with a similar chance of a decline. A baseline scenario sees AMD consolidating sideways below resistance at $220.44 and mid-term resistance at $217.36. A bullish scenario emerges if resistance breaks, targeting $215.00 – $220.00, while a bearish shift is likely if sellers retake control and push the price below $200.00, exposing support at $195.00.
Previously it was reported that AMD shares are trading above key moving averages with short-term support established near the $198 level, while upward momentum is building as the Relative Strength Index signals renewed buying interest. Resistance is seen near the $207 area, with a move above this mark potentially confirming a stronger rebound, whereas a drop below $198 would shift focus back to critical support levels.


Latest AMD News


-
 Afghanistan
-
 Albania
-
 Algeria
-
 Angola
-
 Argentina
-
 Armenia
-
 Australia
-
 Austria
-
 Azerbaijan
-
 Bahamas
-
 Bahrain
-
 Bangladesh
-
 Belarus
-
 Belgium
-
 Bolivia
-
 Botswana
-
 Brazil
-
 Brunei
-
 Bulgaria
-
 Cambodia
-
 Cameroon
-
 Canada
-
 Chile
Chile
-
 China
China
-
 Colombia
-
 Congo
Congo
-
 Costa Rica
-
 Cote d'Ivoire
-
 Croatia
-
 Cuba
Cuba
-
 Cyprus
-
 Czechia
-
 DR Congo
-
 Denmark
-
 Dominican Republic
-
 Ecuador
-
 Egypt
Egypt
-
 El Salvador
-
 Estonia
-
 Eswatini
-
 Ethiopia
-
 Finland
-
 France
-
 Georgia
-
 Germany
-
 Ghana
Ghana
-
 Greece
-
 Haiti
Haiti
-
 Hong Kong
-
 Hungary
-
 India
India
-
 Indonesia
-
 Iran, Islamic republic
-
 Iraq
Iraq
-
 Ireland
-
 Israel
-
 Italy
Italy
-
 Jamaica
-
 Japan
Japan
-
 Jordan
-
 Kazakhstan
-
 Kenya
Kenya
-
 Korea
Korea
-
 Kuwait
-
 Kyrgyzstan
-
 Laos
Laos
-
 Latvia
-
 Lebanon
-
 Lesotho
-
 Libya
Libya
-
 Lithuania
-
 Luxembourg
-
 Madagascar
-
 Malaysia
-
 Malta
Malta
-
 Mauritius
-
 Mexico
-
 Moldova
-
 Mongolia
-
 Montenegro
-
 Morocco
-
 Mozambique
-
 Myanmar
-
 Namibia
-
 Nepal
Nepal
-
 Netherlands
-
 New Zealand
-
 Nigeria
-
 North Macedonia
-
 Norway
-
 Oman
Oman
-
 Pakistan
-
 Palestine
-
 Panama
-
 Papua New Guinea
-
 Paraguay
-
 Peru
Peru
-
 Philippines
-
 Poland
-
 Portugal
-
 Puerto Rico
-
 Qatar
Qatar
-
 Reunion
-
 Romania
-
 Rwanda
-
 Saudi Arabia
-
 Serbia
-
 Singapore
-
 Slovakia
-
 Slovenia
-
 Somalia
-
 South Africa
-
 Spain
Spain
-
 Sri Lanka
-
 Sweden
-
 Switzerland
-
 Syria
Syria
-
 Taiwan
-
 Tajikistan
-
 Tanzania
-
 Thailand
-
 Trinidad and Tobago
-
 Tunisia
-
 Turkey
-
 UAE
UAE
-
 Uganda
-
 Ukraine
-
 United Kingdom
-
United States
-
 Uruguay
-
 Uzbekistan
-
 Venezuela
-
 Vietnam
-
 Yemen
Yemen
-
 Zambia
-
 Zimbabwe
- Forex
- Crypto
