
AMD stock gains as a recent gap signals stronger buyer interest

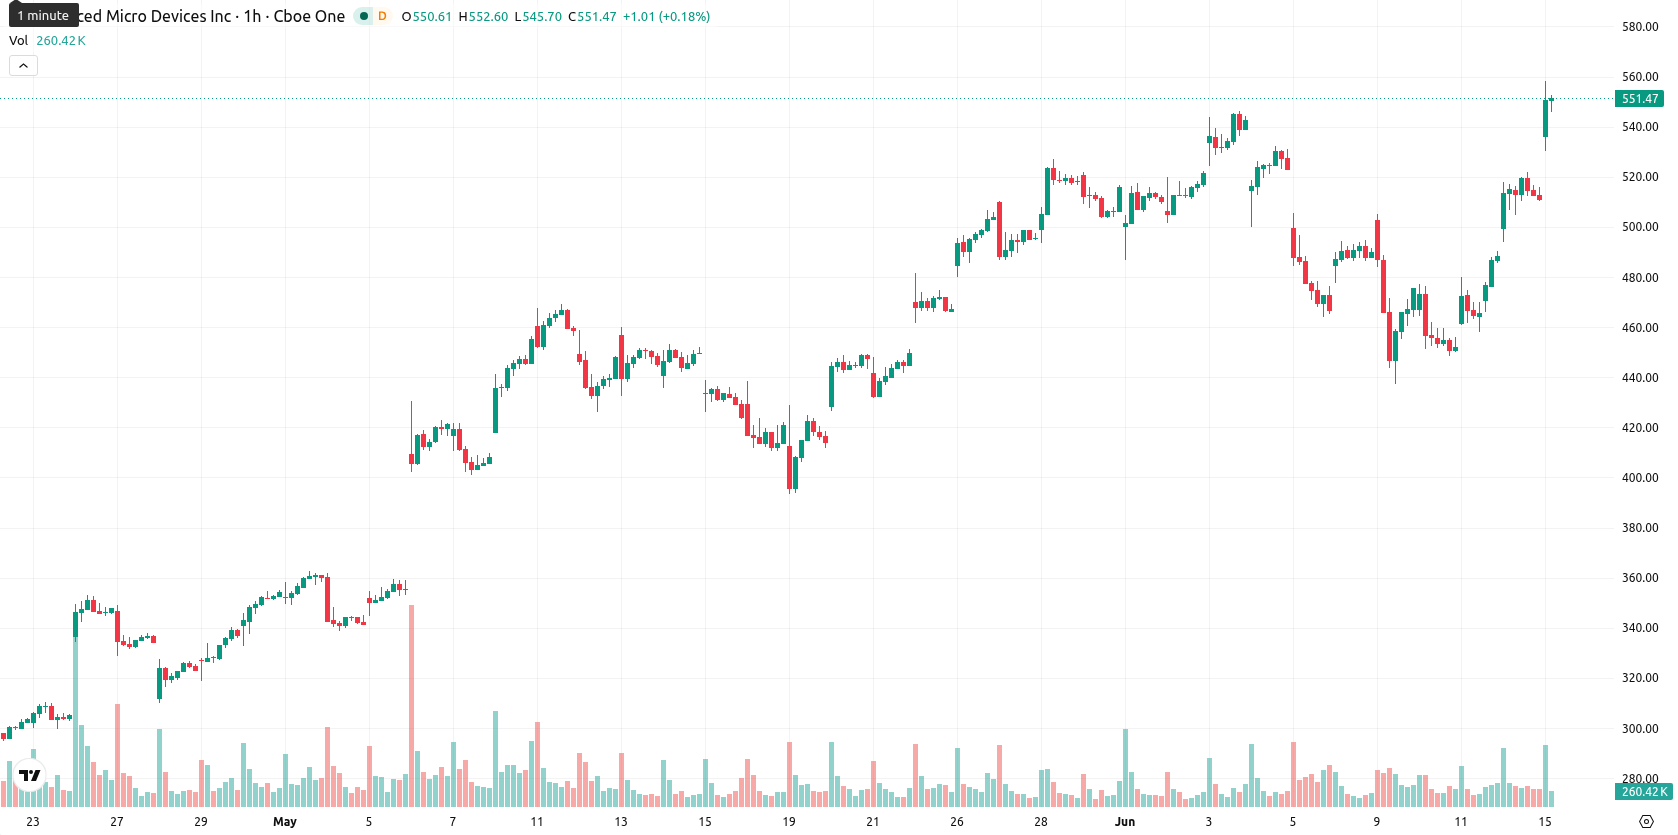
Advanced Micro Devices, Inc. (AMD) stock is trading at $547.28, up 6.93% on the day. The price sits above its key moving averages, reflecting strong short-term and longer-term momentum.
Highlights
- AMD maintains bullish momentum across short-, medium-, and long-term trends, supported by strong technical signals.
- The price closed at $547.28, gaining 6.93% for the day despite an intraday dip and moderate volatility.
- Expected range for the next 2–3 days is $509.66–$584.90, with high probability of upside and key support at $483.75.
Mixed oscillator signals as price outpaces technical supports
On the h1 chart, AMD is positioned above the MA-20 and MA-50, and well above the MA-200 on the daily timeframe. The Ichimoku Kijun at $483.75 provides immediate support. Indicators show positive momentum: MACD remains on a buy signal, while ADX indicates neutral trend strength. RSI reads 63.8 (Buy), and CCI also signals Buy, with Stoch RSI neutral. Bull/Bear Power is overbought, showing dominant buying pressure, and the Awesome Oscillator is neutral. The session closed near the intraday low, with moderate volatility and a gap of $36.48; mixed signals across oscillators and momentum indicators point to some near-term divergence.
Consolidation expected as resistance and support define outlook
Over the upcoming 2–3 trading days, AMD is expected to consolidate within a typical volatility band between $509.66 and $584.90. The high probability scenario is for the price to remain in this corridor. Should resistance be broken, a bullish continuation could unfold, while a sustained move below support near the Kijun may trigger a bearish reversal.
Earlier, analysts noted that AMD’s strong momentum and bullish structure suggested the potential for continued upside. With recent price action reinforcing this trend despite near-term divergences, traders should monitor for a decisive move outside the consolidation corridor, as this could indicate the next directional breakout.


Latest AMD News


-
 Afghanistan
-
 Albania
-
 Algeria
-
 Angola
-
 Argentina
-
 Armenia
-
 Australia
-
 Austria
-
 Azerbaijan
-
 Bahamas
-
 Bahrain
-
 Bangladesh
-
 Belarus
-
 Belgium
-
 Bolivia
-
 Botswana
-
 Brazil
-
 Brunei
-
 Bulgaria
-
 Cambodia
-
 Cameroon
-
 Canada
-
 Chile
Chile
-
 China
China
-
 Colombia
-
 Congo
Congo
-
 Costa Rica
-
 Cote d'Ivoire
-
 Croatia
-
 Cuba
Cuba
-
 Cyprus
-
 Czechia
-
 DR Congo
-
 Denmark
-
 Dominican Republic
-
 Ecuador
-
 Egypt
Egypt
-
 El Salvador
-
 Estonia
-
 Eswatini
-
 Ethiopia
-
 Finland
-
 France
-
 Georgia
-
 Germany
-
 Ghana
Ghana
-
 Greece
-
 Haiti
Haiti
-
 Hong Kong
-
 Hungary
-
 India
India
-
 Indonesia
-
 Iran, Islamic republic
-
 Iraq
Iraq
-
 Ireland
-
 Israel
-
 Italy
Italy
-
 Jamaica
-
 Japan
Japan
-
 Jordan
-
 Kazakhstan
-
 Kenya
Kenya
-
 Korea
Korea
-
 Kuwait
-
 Kyrgyzstan
-
 Laos
Laos
-
 Latvia
-
 Lebanon
-
 Lesotho
-
 Libya
Libya
-
 Lithuania
-
 Luxembourg
-
 Madagascar
-
 Malaysia
-
 Malta
Malta
-
 Mauritius
-
 Mexico
-
 Moldova
-
 Mongolia
-
 Montenegro
-
 Morocco
-
 Mozambique
-
 Myanmar
-
 Namibia
-
 Nepal
Nepal
-
 Netherlands
-
 New Zealand
-
 Nigeria
-
 North Macedonia
-
 Norway
-
 Oman
Oman
-
 Pakistan
-
 Palestine
-
 Panama
-
 Papua New Guinea
-
 Paraguay
-
 Peru
Peru
-
 Philippines
-
 Poland
-
 Portugal
-
 Puerto Rico
-
 Qatar
Qatar
-
 Reunion
-
 Romania
-
 Rwanda
-
 Saudi Arabia
-
 Serbia
-
 Singapore
-
 Slovakia
-
 Slovenia
-
 Somalia
-
 South Africa
-
 Spain
Spain
-
 Sri Lanka
-
 Sweden
-
 Switzerland
-
 Syria
Syria
-
 Taiwan
-
 Tajikistan
-
 Tanzania
-
 Thailand
-
 Trinidad and Tobago
-
 Tunisia
-
 Turkey
-
 UAE
UAE
-
 Uganda
-
 Ukraine
-
 United Kingdom
-
United States
-
 Uruguay
-
 Uzbekistan
-
 Venezuela
-
 Vietnam
-
 Yemen
Yemen
-
 Zambia
-
 Zimbabwe
- Forex
- Crypto
