
+5.56% for Core Scientific stock — Mixed indicators after auditor adjustment and session volatility

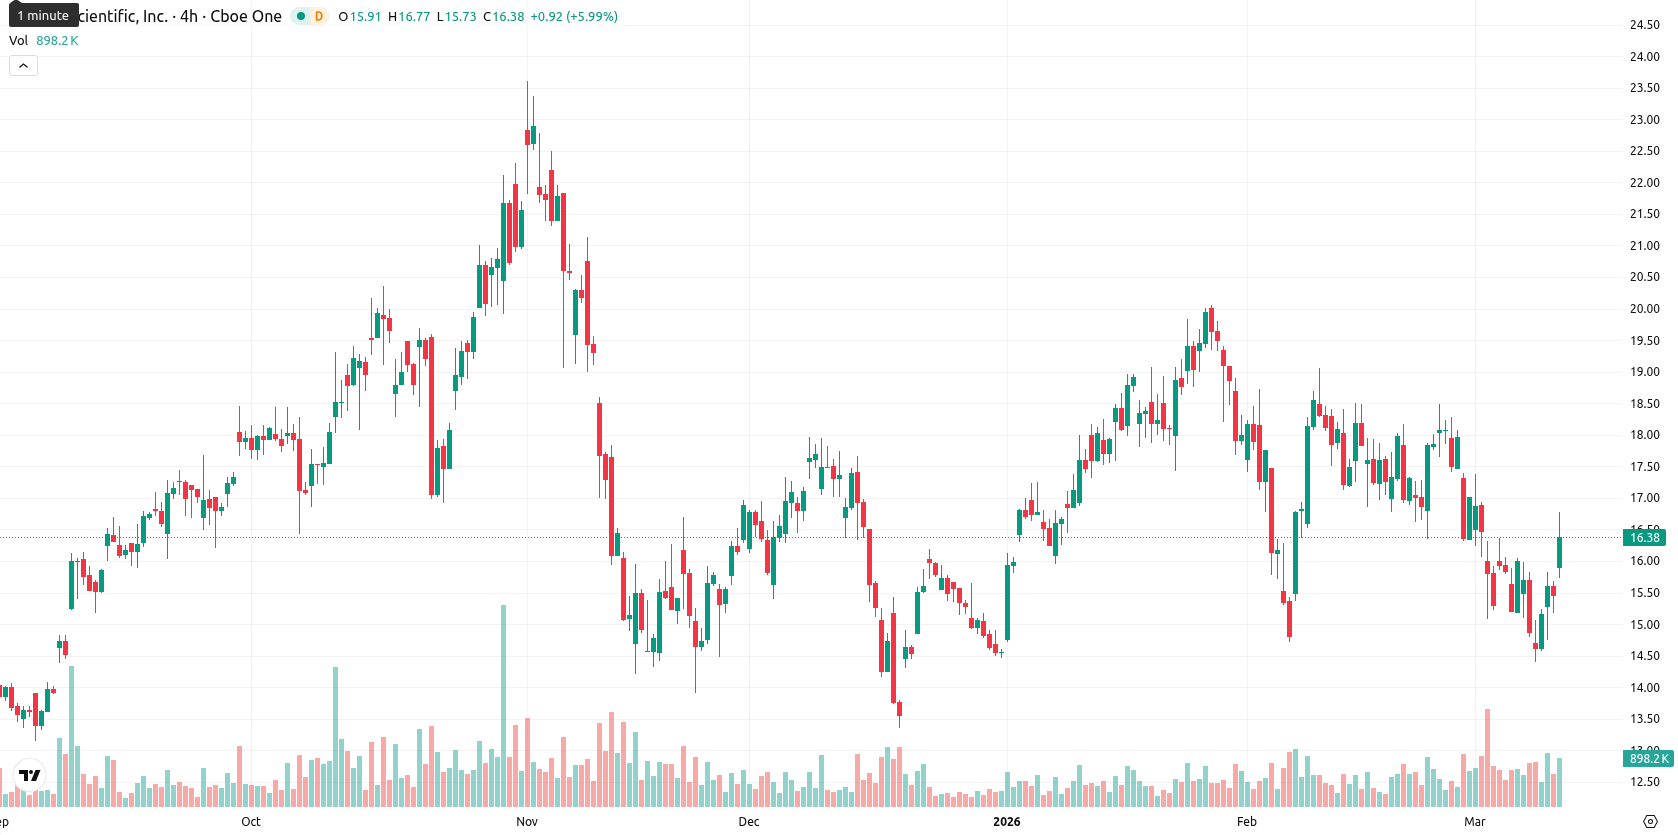
Core Scientific Inc. (CORZ) is trading at $16.32 after a 5.56% rise in the session. The asset currently sits below its SMA-20 ($16.91) and SMA-50 ($17.17), but remains above the SMA-200 ($15.87), indicating persistent short- and medium-term selling pressure while holding above longer-term support levels.
Highlights
- Core Scientific restated financials after auditors found demolition costs were wrongly capitalized, spotlighting governance and oversight issues.
- A material weakness in internal controls will be reported for four quarters, affecting market perception despite no impact to revenue or cash flow.
- Technically, CORZ faces short- and medium-term selling pressure with limited upside probability and likely sideways or downward movement in the $15.78–$17.26 range.
Governance scrutiny rises as audit findings prompt material weakness disclosure
Core Scientific recently held its Q4 earnings call, during which the company disclosed amended financial statements after its auditor identified demolition costs that were incorrectly capitalized rather than expensed. These adjustments do not affect revenue, adjusted EBITDA, or net cash flow, but the company will report a material weakness in internal controls for the next four quarters, bringing attention to governance and oversight concerns. These developments are the main drivers influencing sentiment toward Core Scientific.
Mixed bearish momentum as resistance and oversold signals converge
Technically, the Ichimoku Kijun at $16.73 acts as immediate resistance above the current price. Momentum signals are mixed: the D1 MACD remains negative and suggests a sell bias, while ADX is neutral and points to weak trend strength. RSI (41.67), CCI (-117.23), and BBP (-0.41) show the market is leaning oversold, though Stoch RSI is neutral. Intraday, sellers dominate, but some short-term oscillators show brief overbought divergence on lower timeframes. Price currently trades mid-range between today's high ($16.76) and low ($15.84), after a moderate volatility session and renewed strength following the open.
Sideways price bias as technical indecision dampens upside odds
Looking ahead, CORZ is expected to trade within a $15.78 to $17.26 volatility band relative to current levels over the next five sessions. There is a very low probability (less than 20%) of an upward move in the short term, making a downward or sideways move more likely. The baseline expectation is for the price to remain in a sideways corridor, consistent with the mixed and indecisive technical outlook. A breakout above $16.73 would suggest additional upside potential, while a drop below $15.87 could prompt further selling pressure.
Last time, analysts noted Core Scientific Inc. (CORZ) was trading below its short-term moving averages but remained above its long-term SMA-200, reflecting mixed technical signals with short-term pressure. Momentum indicators such as MACD and RSI continue to show prevailing bearish sentiment and oversold conditions, while dynamic support is identified near $15.87 and resistance at $17.17.


Latest Core Scientific News


-
 Afghanistan
-
 Albania
-
 Algeria
-
 Angola
-
 Argentina
-
 Armenia
-
 Australia
-
 Austria
-
 Azerbaijan
-
 Bahamas
-
 Bahrain
-
 Bangladesh
-
 Belarus
-
 Belgium
-
 Bolivia
-
 Botswana
-
 Brazil
-
 Brunei
-
 Bulgaria
-
 Cambodia
-
 Cameroon
-
 Canada
-
 Chile
Chile
-
 China
China
-
 Colombia
-
 Congo
Congo
-
 Costa Rica
-
 Cote d'Ivoire
-
 Croatia
-
 Cuba
Cuba
-
 Cyprus
-
 Czechia
-
 DR Congo
-
 Denmark
-
 Dominican Republic
-
 Ecuador
-
 Egypt
Egypt
-
 El Salvador
-
 Estonia
-
 Eswatini
-
 Ethiopia
-
 Finland
-
 France
-
 Georgia
-
 Germany
-
 Ghana
Ghana
-
 Greece
-
 Haiti
Haiti
-
 Hong Kong
-
 Hungary
-
 India
India
-
 Indonesia
-
 Iran, Islamic republic
-
 Iraq
Iraq
-
 Ireland
-
 Israel
-
 Italy
Italy
-
 Jamaica
-
 Japan
Japan
-
 Jordan
-
 Kazakhstan
-
 Kenya
Kenya
-
 Korea
Korea
-
 Kuwait
-
 Kyrgyzstan
-
 Laos
Laos
-
 Latvia
-
 Lebanon
-
 Lesotho
-
 Libya
Libya
-
 Lithuania
-
 Luxembourg
-
 Madagascar
-
 Malaysia
-
 Malta
Malta
-
 Mauritius
-
 Mexico
-
 Moldova
-
 Mongolia
-
 Montenegro
-
 Morocco
-
 Mozambique
-
 Myanmar
-
 Namibia
-
 Nepal
Nepal
-
 Netherlands
-
 New Zealand
-
 Nigeria
-
 North Macedonia
-
 Norway
-
 Oman
Oman
-
 Pakistan
-
 Palestine
-
 Panama
-
 Papua New Guinea
-
 Paraguay
-
 Peru
Peru
-
 Philippines
-
 Poland
-
 Portugal
-
 Puerto Rico
-
 Qatar
Qatar
-
 Reunion
-
 Romania
-
 Rwanda
-
 Saudi Arabia
-
 Serbia
-
 Singapore
-
 Slovakia
-
 Slovenia
-
 Somalia
-
 South Africa
-
 Spain
Spain
-
 Sri Lanka
-
 Sweden
-
 Switzerland
-
 Syria
Syria
-
 Taiwan
-
 Tajikistan
-
 Tanzania
-
 Thailand
-
 Trinidad and Tobago
-
 Tunisia
-
 Turkey
-
 UAE
UAE
-
 Uganda
-
 Ukraine
-
 United Kingdom
-
United States
-
 Uruguay
-
 Uzbekistan
-
 Venezuela
-
 Vietnam
-
 Yemen
Yemen
-
 Zambia
-
 Zimbabwe
- Forex
- Crypto
