
Core Scientific stock: Governance risks and accounting tweaks trigger a drop

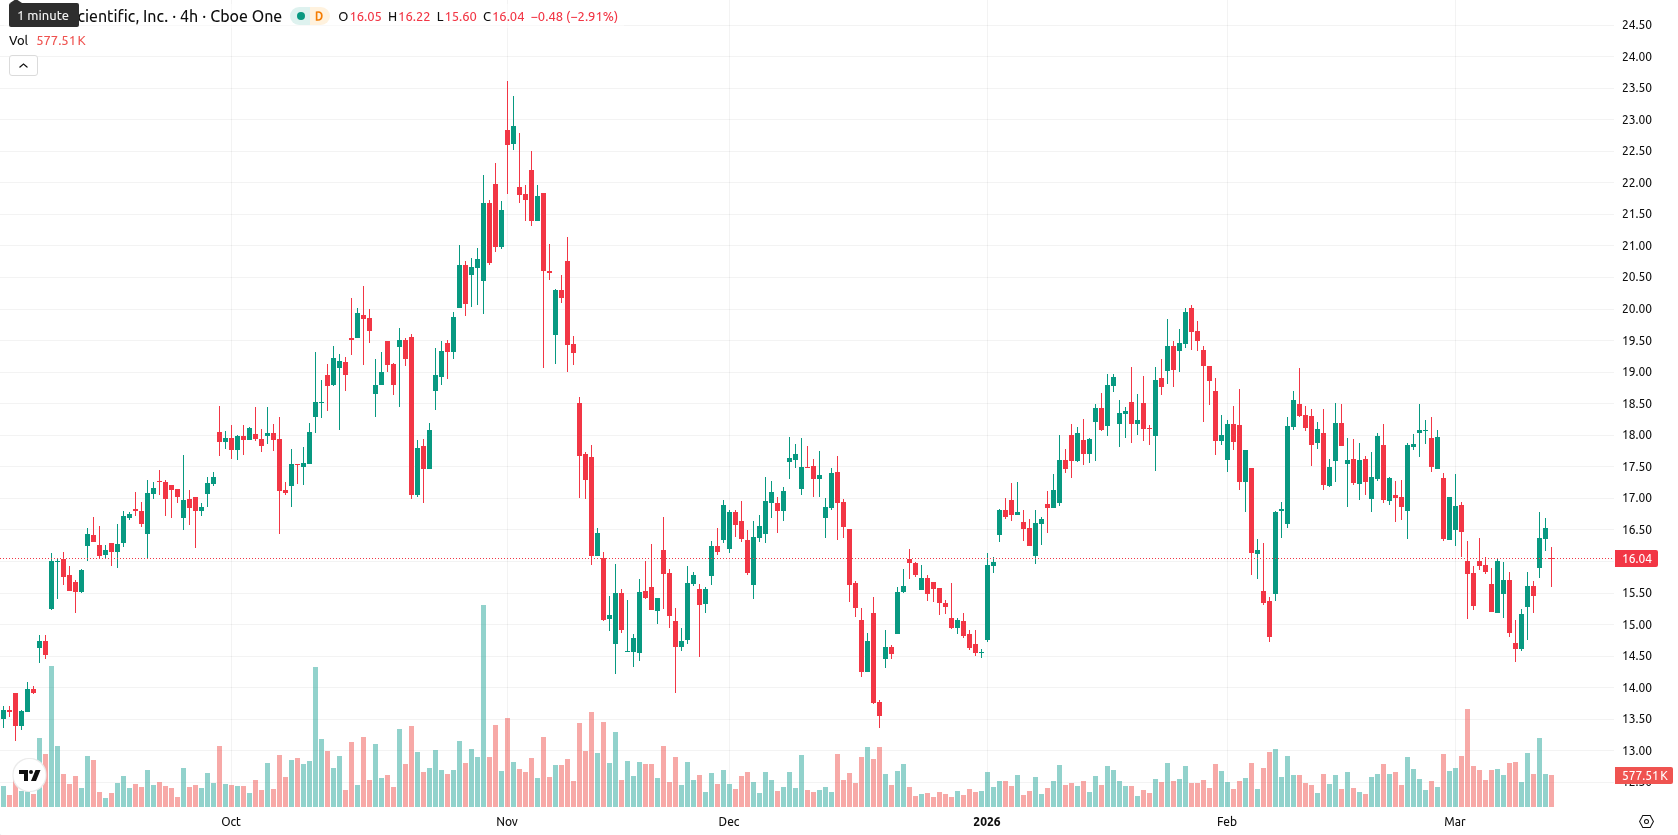
Core Scientific, Inc. (CORZ) is trading at $16.03, down $0.51 or 3.08% on the day. The asset is positioned below both the SMA-20 ($16.83) and SMA-50 ($17.19), while maintaining a modestly higher stance above the SMA-200 ($15.89), highlighting ongoing short- and mid-term selling pressure with some longer-term technical support.
Highlights
- Core Scientific restated financials after incorrectly capitalizing demolition costs, prompting disclosure of internal controls weaknesses for the next year.
- Governance and oversight concerns emerged during the correction period, while overall revenue, adjusted EBITDA, and cash flow remain unaffected.
- CORZ trades below key short- and medium-term averages under seller pressure, with $15.80–$17.25 the likely range and 75% probability of an upward move.
Governance concerns rise as accounting errors prompt control weakness disclosure
Core Scientific disclosed that it filed amended financial statements after its auditor identified demolition costs that were incorrectly capitalized instead of expensed. The company stated these corrections do not impact revenue, adjusted EBITDA, or net cash flow, but it will report a material weakness in internal controls for the next four quarters. The Q4 earnings call provided further updates on these accounting adjustments. Governance and oversight risks were noted during this period, though price action has remained under broader selling pressure.
Oscillator-momentum divergence as resistance caps intraday buyer activity
Technically, D1 momentum signals are mixed: the MACD issues a sell signal and the ADX remains neutral, indicating a lack of clear directional force. RSI sits near neutral at 48.88 with a sell signal present, while Stoch RSI and CCI hover in neutral ranges, pointing to the absence of overbought or oversold extremes. BBP is at 0.50 and overbought, suggesting intraday buyer dominance even as price sits near the day's low and volatility is moderate. The Ichimoku Kijun at $16.73 marks immediate resistance, and divergence between oscillators and momentum readings remains evident.
Bullish bias prevails as volatility band defines near-term pivots
For the short term, CORZ is expected to fluctuate within a volatility band between $15.80 and $17.25. The probability of price moving higher is estimated at 75%, making upward action more likely, though a sideways trajectory between support and resistance is considered the baseline. A break above $16.73 would open a bullish scenario, while a decisive move below $15.80 would signal rising bearish risks.
Previously it was reported that Core Scientific Inc. is currently experiencing mixed technical momentum, trading below its short- and medium-term moving averages but holding above its long-term SMA-200, with the price facing immediate resistance near $16.73 amid persistent governance scrutiny following an internal control weakness disclosure. Momentum indicators, including a negative MACD and oversold RSI readings, suggest continued bearish sentiment and weak trend strength, pointing to a likely sideways or downward move within the established volatility range unless a breakout above resistance occurs.


Latest Core Scientific News


-
 Afghanistan
-
 Albania
-
 Algeria
-
 Angola
-
 Argentina
-
 Armenia
-
 Australia
-
 Austria
-
 Azerbaijan
-
 Bahamas
-
 Bahrain
-
 Bangladesh
-
 Belarus
-
 Belgium
-
 Bolivia
-
 Botswana
-
 Brazil
-
 Brunei
-
 Bulgaria
-
 Cambodia
-
 Cameroon
-
 Canada
-
 Chile
Chile
-
 China
China
-
 Colombia
-
 Congo
Congo
-
 Costa Rica
-
 Cote d'Ivoire
-
 Croatia
-
 Cuba
Cuba
-
 Cyprus
-
 Czechia
-
 DR Congo
-
 Denmark
-
 Dominican Republic
-
 Ecuador
-
 Egypt
Egypt
-
 El Salvador
-
 Estonia
-
 Eswatini
-
 Ethiopia
-
 Finland
-
 France
-
 Georgia
-
 Germany
-
 Ghana
Ghana
-
 Greece
-
 Haiti
Haiti
-
 Hong Kong
-
 Hungary
-
 India
India
-
 Indonesia
-
 Iran, Islamic republic
-
 Iraq
Iraq
-
 Ireland
-
 Israel
-
 Italy
Italy
-
 Jamaica
-
 Japan
Japan
-
 Jordan
-
 Kazakhstan
-
 Kenya
Kenya
-
 Korea
Korea
-
 Kuwait
-
 Kyrgyzstan
-
 Laos
Laos
-
 Latvia
-
 Lebanon
-
 Lesotho
-
 Libya
Libya
-
 Lithuania
-
 Luxembourg
-
 Madagascar
-
 Malaysia
-
 Malta
Malta
-
 Mauritius
-
 Mexico
-
 Moldova
-
 Mongolia
-
 Montenegro
-
 Morocco
-
 Mozambique
-
 Myanmar
-
 Namibia
-
 Nepal
Nepal
-
 Netherlands
-
 New Zealand
-
 Nigeria
-
 North Macedonia
-
 Norway
-
 Oman
Oman
-
 Pakistan
-
 Palestine
-
 Panama
-
 Papua New Guinea
-
 Paraguay
-
 Peru
Peru
-
 Philippines
-
 Poland
-
 Portugal
-
 Puerto Rico
-
 Qatar
Qatar
-
 Reunion
-
 Romania
-
 Rwanda
-
 Saudi Arabia
-
 Serbia
-
 Singapore
-
 Slovakia
-
 Slovenia
-
 Somalia
-
 South Africa
-
 Spain
Spain
-
 Sri Lanka
-
 Sweden
-
 Switzerland
-
 Syria
Syria
-
 Taiwan
-
 Tajikistan
-
 Tanzania
-
 Thailand
-
 Trinidad and Tobago
-
 Tunisia
-
 Turkey
-
 UAE
UAE
-
 Uganda
-
 Ukraine
-
 United Kingdom
-
United States
-
 Uruguay
-
 Uzbekistan
-
 Venezuela
-
 Vietnam
-
 Yemen
Yemen
-
 Zambia
-
 Zimbabwe
- Forex
- Crypto
