
AMD stock: Technical uncertainty and weak trend halt upward progress

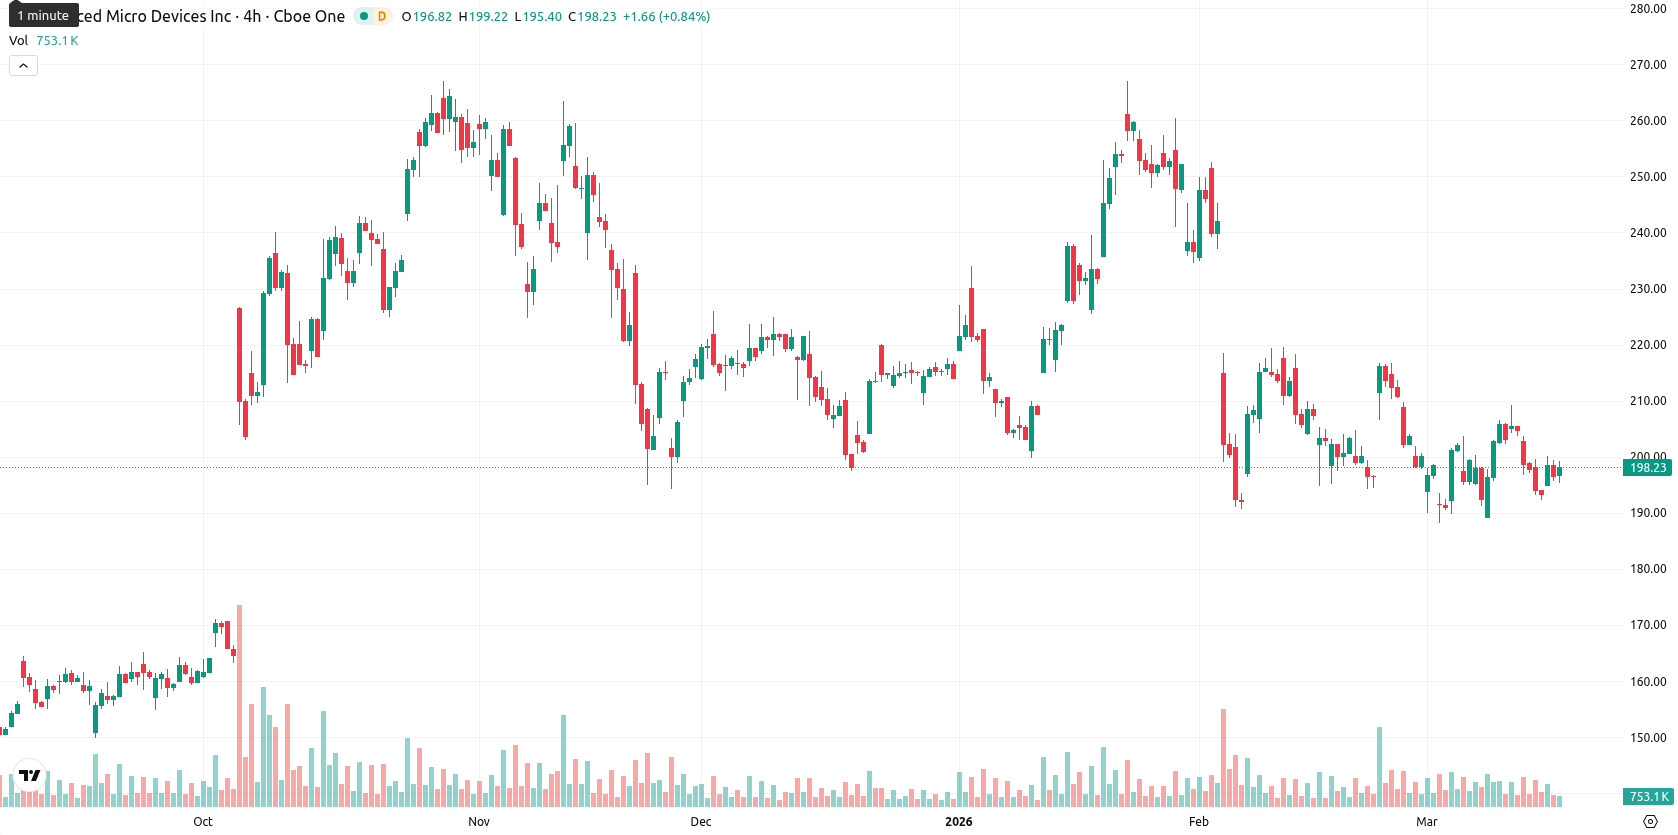
Advanced Micro Devices, Inc. (AMD) is trading at $197.48, below both the SMA-20 ($200.69) and SMA-50 ($215.77), but above the SMA-200 ($191.23). This setup reflects short- and medium-term pressure from sellers, while longer-term support remains intact. The Ichimoku Kijun at $203.94 sits above the current price and thus serves as immediate resistance.
Highlights
- AMD trades below key short- and medium-term averages, indicating persistent selling pressure and a lack of upward momentum.
- Momentum indicators present mixed signals, but sellers dominate as oscillators trend mildly bearish and the trend strength remains weak.
- Price is expected to consolidate within the $187–$207 range over the next five days, with declines more likely unless $204–$207 resistance is broken.
Conflicting momentum and volatility as trend signals diverge
Momentum indicators remain mixed: the MACD on D1 signals strong selling pressure, while the ADX suggests weak trend strength. RSI, CCI, and Stoch RSI lean mildly bearish to neutral, with the RSI at 44.24 and CCI negative, while BBP’s low reading (0.21) and “Oversold” status indicate sellers still dominate intraday action. The daily gain of 0.46% follows an almost flat open versus the previous close, with the current price sitting near the middle of today’s range ($195.42 – $199.21), reflecting moderate volatility and a sideways tone in early trading. Divergent signals between momentum and oscillators highlight ongoing uncertainty, confirming a lack of clear short-term direction.
Downside favored with narrow breakout risk in coming sessions
For the next 5 trading days, AMD is expected to trade between $187 and $207, normalized to reflect recent volatility. The likelihood of a sustained upward move is very low (less than 20%), making further declines more likely in the short term. The baseline scenario is for prices to consolidate within the current range. A bullish scenario would require a break above the $204 – $207 resistance area, while a bearish scenario comes into play on a drop below $191 support, targeting the lower end of the projected range.
Previously it was reported that AMD was contending with persistent short- and medium-term bearish momentum despite support from longer-term technical factors and shifting market catalysts. The latest analysis strengthens this view by highlighting ongoing mixed signals and subdued upside potential, suggesting traders should monitor for a decisive move outside the $187–$207 range as the basis for the next directional trend.


-
 Afghanistan
-
 Albania
-
 Algeria
-
 Angola
-
 Argentina
-
 Armenia
-
 Australia
-
 Austria
-
 Azerbaijan
-
 Bahamas
-
 Bahrain
-
 Bangladesh
-
 Belarus
-
 Belgium
-
 Bolivia
-
 Botswana
-
 Brazil
-
 Brunei
-
 Bulgaria
-
 Cambodia
-
 Cameroon
-
 Canada
-
 Chile
Chile
-
 China
China
-
 Colombia
-
 Congo
Congo
-
 Costa Rica
-
 Cote d'Ivoire
-
 Croatia
-
 Cuba
Cuba
-
 Cyprus
-
 Czechia
-
 DR Congo
-
 Denmark
-
 Dominican Republic
-
 Ecuador
-
 Egypt
Egypt
-
 El Salvador
-
 Estonia
-
 Eswatini
-
 Ethiopia
-
 Finland
-
 France
-
 Georgia
-
 Germany
-
 Ghana
Ghana
-
 Greece
-
 Haiti
Haiti
-
 Hong Kong
-
 Hungary
-
 India
India
-
 Indonesia
-
 Iran, Islamic republic
-
 Iraq
Iraq
-
 Ireland
-
 Israel
-
 Italy
Italy
-
 Jamaica
-
 Japan
Japan
-
 Jordan
-
 Kazakhstan
-
 Kenya
Kenya
-
 Korea
Korea
-
 Kuwait
-
 Kyrgyzstan
-
 Laos
Laos
-
 Latvia
-
 Lebanon
-
 Lesotho
-
 Libya
Libya
-
 Lithuania
-
 Luxembourg
-
 Madagascar
-
 Malaysia
-
 Malta
Malta
-
 Mauritius
-
 Mexico
-
 Moldova
-
 Mongolia
-
 Montenegro
-
 Morocco
-
 Mozambique
-
 Myanmar
-
 Namibia
-
 Nepal
Nepal
-
 Netherlands
-
 New Zealand
-
 Nigeria
-
 North Macedonia
-
 Norway
-
 Oman
Oman
-
 Pakistan
-
 Palestine
-
 Panama
-
 Papua New Guinea
-
 Paraguay
-
 Peru
Peru
-
 Philippines
-
 Poland
-
 Portugal
-
 Puerto Rico
-
 Qatar
Qatar
-
 Reunion
-
 Romania
-
 Rwanda
-
 Saudi Arabia
-
 Serbia
-
 Singapore
-
 Slovakia
-
 Slovenia
-
 Somalia
-
 South Africa
-
 Spain
Spain
-
 Sri Lanka
-
 Sweden
-
 Switzerland
-
 Syria
Syria
-
 Taiwan
-
 Tajikistan
-
 Tanzania
-
 Thailand
-
 Trinidad and Tobago
-
 Tunisia
-
 Turkey
-
 UAE
UAE
-
 Uganda
-
 Ukraine
-
 United Kingdom
-
United States
-
 Uruguay
-
 Uzbekistan
-
 Venezuela
-
 Vietnam
-
 Yemen
Yemen
-
 Zambia
-
 Zimbabwe
- Forex
- Crypto
