
Technical volatility, Danske Bank investment: T-Mobile stock slides 3.11%

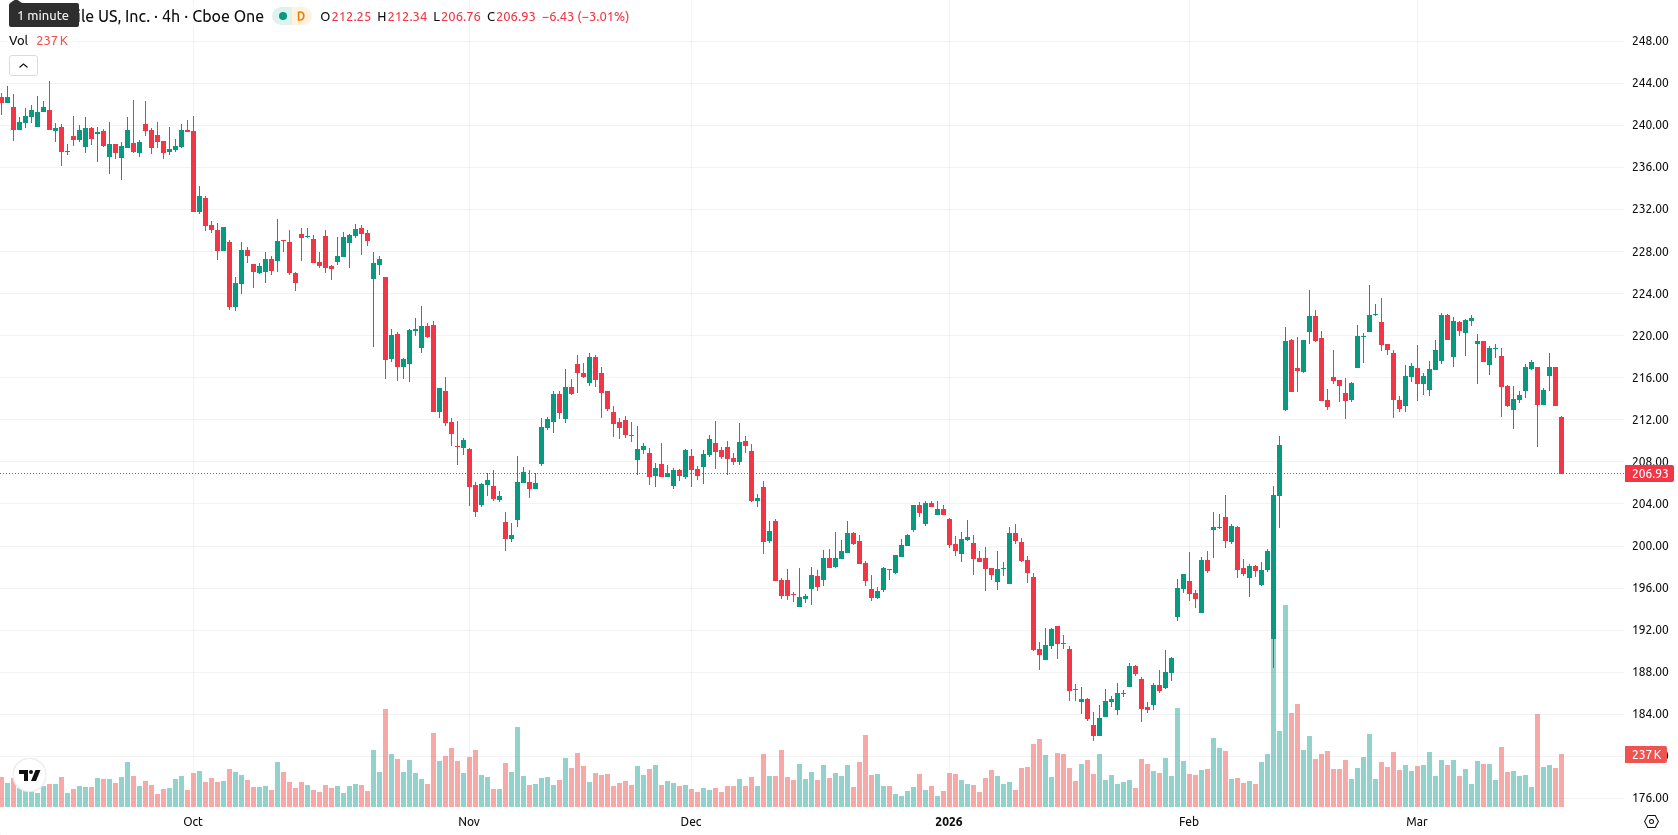
T-Mobile US, Inc. (TMUS) is trading at $206.81, below the SMA-20 ($217.06) and SMA-200 ($222.01), but just above the SMA-50 ($204.61). This indicates short-term and long-term downside momentum, while medium-term support may emerge near the 50-day average.
 189.83
189.83
189.83
Highlights
- Danske Bank invested $77.20 million in T-Mobile, acquiring 322,502 shares during the third quarter, as reported in SEC filings.
- T-Mobile maintains a large market capitalization of $235.08 billion but faces ongoing selling pressure in the broader market environment.
- Technical signals show TMUS trading below key averages with mixed momentum, expecting a range between $202.00 and $214.00 and a low probability of upward breakout.
Institutional investment increase as price faces ongoing selling pressure
Danske Bank A S reported an investment of approximately $77.20 million in T-Mobile by acquiring 322,502 shares during the third quarter as disclosed in a recent SEC filing. This announcement was accompanied by a reported market capitalization of $235.08 billion, though price action has remained under broader selling pressure.
Mixed momentum and lower range trade as technical indicators diverge
The Ichimoku Kijun is at $206.45, which sits just below the current price and now acts as immediate support. Momentum signals are mixed: the D1 MACD suggests strong buy momentum, but the ADX is neutral at a low value, signaling weak trend strength. RSI is modestly bullish at 50.40, while CCI remains bearish and the Stoch RSI is oversold, hinting at near-term exhaustion from sellers. BBP shows recent buyer dominance, but intraday timeframes point to sellers regaining control. TMUS gapped down after yesterday’s close and now trades at the lower end of today’s volatile range, as multiple oscillators and momentum readings diverge, confirming persistent uncertainty with sellers weighing on the session.
Limited upside as sideways and downside scenarios dominate outlook
For the coming week, TMUS is expected to trade within a typical volatility band between $202.00 and $214.00 based on current conditions. The probability of a significant upward move is very low (less than 20%), making a decline more likely. The baseline scenario is for the price to move sideways above $206 as buyers and sellers battle for dominance. A bullish scenario would require a breakout above resistance near $211.80 — $214.00 with strong momentum, while a bearish scenario emerges if TMUS falls below support at $206.45, opening downside risk toward $202.00.
Earlier, analysts noted that T-Mobile was facing continued downside pressure amid volatile trading and mixed technical signals. The current action maintains this cautious outlook, with persistent uncertainty making a drop below $206.45 a key level to watch for potential renewed selling toward $202.00.





Latest T-Mobile News








-
 Afghanistan
-
 Albania
-
 Algeria
-
 Angola
-
 Argentina
-
 Armenia
-
 Australia
-
 Austria
-
 Azerbaijan
-
 Bahamas
-
 Bahrain
-
 Bangladesh
-
 Belarus
-
 Belgium
-
 Bolivia
-
 Botswana
-
 Brazil
-
 Brunei
-
 Bulgaria
-
 Cambodia
-
 Cameroon
-
 Canada
-
 Chile
Chile
-
 China
China
-
 Colombia
-
 Congo
Congo
-
 Costa Rica
-
 Cote d'Ivoire
-
 Croatia
-
 Cuba
Cuba
-
 Cyprus
-
 Czechia
-
 DR Congo
-
 Denmark
-
 Dominican Republic
-
 Ecuador
-
 Egypt
Egypt
-
 El Salvador
-
 Estonia
-
 Eswatini
-
 Ethiopia
-
 Finland
-
 France
-
 Georgia
-
 Germany
-
 Ghana
Ghana
-
 Greece
-
 Haiti
Haiti
-
 Hong Kong
-
 Hungary
-
 India
India
-
 Indonesia
-
 Iran, Islamic republic
-
 Iraq
Iraq
-
 Ireland
-
 Israel
-
 Italy
Italy
-
 Jamaica
-
 Japan
Japan
-
 Jordan
-
 Kazakhstan
-
 Kenya
Kenya
-
 Korea
Korea
-
 Kuwait
-
 Kyrgyzstan
-
 Laos
Laos
-
 Latvia
-
 Lebanon
-
 Lesotho
-
 Libya
Libya
-
 Lithuania
-
 Luxembourg
-
 Madagascar
-
 Malaysia
-
 Malta
Malta
-
 Mauritius
-
 Mexico
-
 Moldova
-
 Mongolia
-
 Montenegro
-
 Morocco
-
 Mozambique
-
 Myanmar
-
 Namibia
-
 Nepal
Nepal
-
 Netherlands
-
 New Zealand
-
 Nigeria
-
 North Macedonia
-
 Norway
-
 Oman
Oman
-
 Pakistan
-
 Palestine
-
 Panama
-
 Papua New Guinea
-
 Paraguay
-
 Peru
Peru
-
 Philippines
-
 Poland
-
 Portugal
-
 Puerto Rico
-
 Qatar
Qatar
-
 Reunion
-
 Romania
-
 Rwanda
-
 Saudi Arabia
-
 Serbia
-
 Singapore
-
 Slovakia
-
 Slovenia
-
 Somalia
-
 South Africa
-
 Spain
Spain
-
 Sri Lanka
-
 Sweden
-
 Switzerland
-
 Syria
Syria
-
 Taiwan
-
 Tajikistan
-
 Tanzania
-
 Thailand
-
 Trinidad and Tobago
-
 Tunisia
-
 Turkey
-
 UAE
UAE
-
 Uganda
-
 Ukraine
-
 United Kingdom
-
United States
-
 Uruguay
-
 Uzbekistan
-
 Venezuela
-
 Vietnam
-
 Yemen
Yemen
-
 Zambia
-
 Zimbabwe
- Forex
- Crypto











