
-3.72% for JetBlue Airways stock as selling pressure remains strong

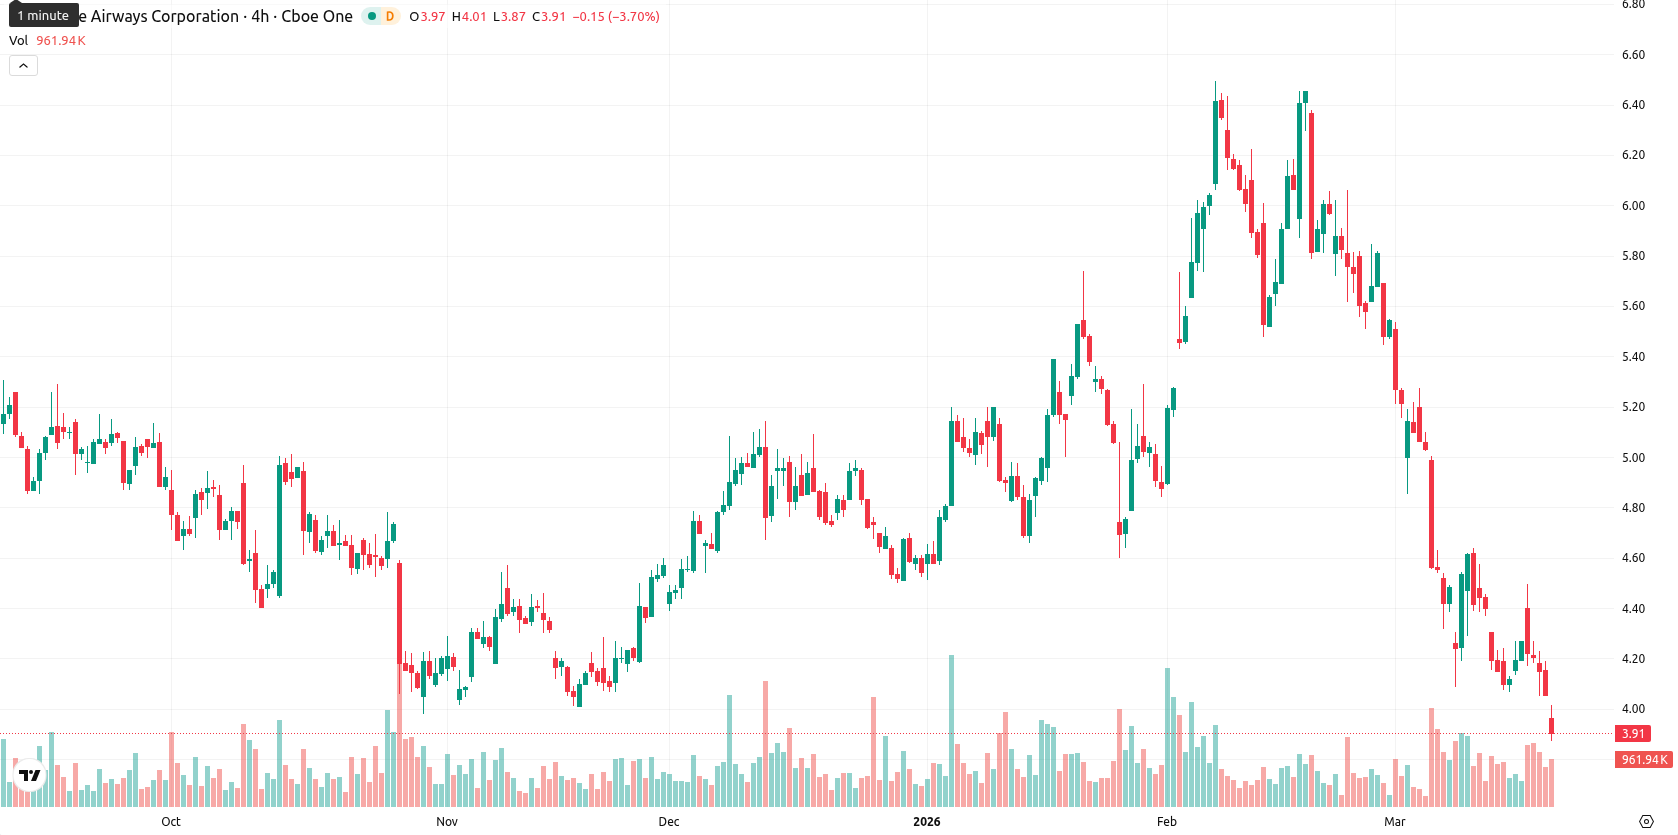
JetBlue Airways Corp (JBLU) is trading at $3.91 after a daily decline of 3.72%. The stock remains well below its SMA-20 ($4.95), SMA-50 ($5.23), and SMA-200 ($4.81), underscoring persistent selling pressure across short-, medium-, and long-term trends.
Highlights
- JBLU maintains a persistent downtrend, trading significantly below key moving averages and underlining continuous selling pressure.
- Technical indicators confirm weak momentum and oversold conditions, with bears controlling intraday price action and volatility remaining elevated.
- JBLU is expected to fluctuate between $3.88 and $4.20 over the next five days, with a high probability of further declines.
Oversold signals intensify as resistance caps bearish momentum
JBLU's technical setup shows continued weakness, with the Ichimoku Kijun level at $5.26 acting as immediate resistance above current prices. Momentum on the daily chart is negative, with the MACD and ADX both generating sell signals. Indicators such as RSI (30.47), Stoch RSI (6.49), and CCI (–90.67) confirm pronounced oversold conditions, while BBP at –0.30 and the Awesome Oscillator support a strong bearish bias. The stock is trading near the low end of its intraday range ($3.88–$4.01), reflecting elevated volatility and ongoing downside momentum.
Downside risk persists as breakout potential remains limited
Over the next five trading days, JBLU is expected to fluctuate within a volatility band between $3.88 and $4.20. The probability of a price increase is very low (less than 20%), suggesting a higher likelihood of further declines. The baseline outlook calls for sideways movement inside this range. A breakout above immediate resistance could trigger a bullish reversal, while a break below support would extend the current downtrend.
Earlier, analysts noted that JetBlue shares were under persistent bearish pressure driven by negative technical momentum and ongoing operational headwinds. The continued deterioration in selling pressure, with momentum and volatility remaining elevated, now puts focus on whether JBLU can maintain support above $3.88 or risk triggering a deeper breakdown in the near term.


-
 Afghanistan
-
 Albania
-
 Algeria
-
 Angola
-
 Argentina
-
 Armenia
-
 Australia
-
 Austria
-
 Azerbaijan
-
 Bahamas
-
 Bahrain
-
 Bangladesh
-
 Belarus
-
 Belgium
-
 Bolivia
-
 Botswana
-
 Brazil
-
 Brunei
-
 Bulgaria
-
 Cambodia
-
 Cameroon
-
 Canada
-
 Chile
Chile
-
 China
China
-
 Colombia
-
 Congo
Congo
-
 Costa Rica
-
 Cote d'Ivoire
-
 Croatia
-
 Cuba
Cuba
-
 Cyprus
-
 Czechia
-
 DR Congo
-
 Denmark
-
 Dominican Republic
-
 Ecuador
-
 Egypt
Egypt
-
 El Salvador
-
 Estonia
-
 Eswatini
-
 Ethiopia
-
 Finland
-
 France
-
 Georgia
-
 Germany
-
 Ghana
Ghana
-
 Greece
-
 Haiti
Haiti
-
 Hong Kong
-
 Hungary
-
 India
India
-
 Indonesia
-
 Iran, Islamic republic
-
 Iraq
Iraq
-
 Ireland
-
 Israel
-
 Italy
Italy
-
 Jamaica
-
 Japan
Japan
-
 Jordan
-
 Kazakhstan
-
 Kenya
Kenya
-
 Korea
Korea
-
 Kuwait
-
 Kyrgyzstan
-
 Laos
Laos
-
 Latvia
-
 Lebanon
-
 Lesotho
-
 Libya
Libya
-
 Lithuania
-
 Luxembourg
-
 Madagascar
-
 Malaysia
-
 Malta
Malta
-
 Mauritius
-
 Mexico
-
 Moldova
-
 Mongolia
-
 Montenegro
-
 Morocco
-
 Mozambique
-
 Myanmar
-
 Namibia
-
 Nepal
Nepal
-
 Netherlands
-
 New Zealand
-
 Nigeria
-
 North Macedonia
-
 Norway
-
 Oman
Oman
-
 Pakistan
-
 Palestine
-
 Panama
-
 Papua New Guinea
-
 Paraguay
-
 Peru
Peru
-
 Philippines
-
 Poland
-
 Portugal
-
 Puerto Rico
-
 Qatar
Qatar
-
 Reunion
-
 Romania
-
 Rwanda
-
 Saudi Arabia
-
 Serbia
-
 Singapore
-
 Slovakia
-
 Slovenia
-
 Somalia
-
 South Africa
-
 Spain
Spain
-
 Sri Lanka
-
 Sweden
-
 Switzerland
-
 Syria
Syria
-
 Taiwan
-
 Tajikistan
-
 Tanzania
-
 Thailand
-
 Trinidad and Tobago
-
 Tunisia
-
 Turkey
-
 UAE
UAE
-
 Uganda
-
 Ukraine
-
 United Kingdom
-
United States
-
 Uruguay
-
 Uzbekistan
-
 Venezuela
-
 Vietnam
-
 Yemen
Yemen
-
 Zambia
-
 Zimbabwe
- Forex
- Crypto
