
Short-term strength offset by steady selling knocks JetBlue Airways stock down 3.25%

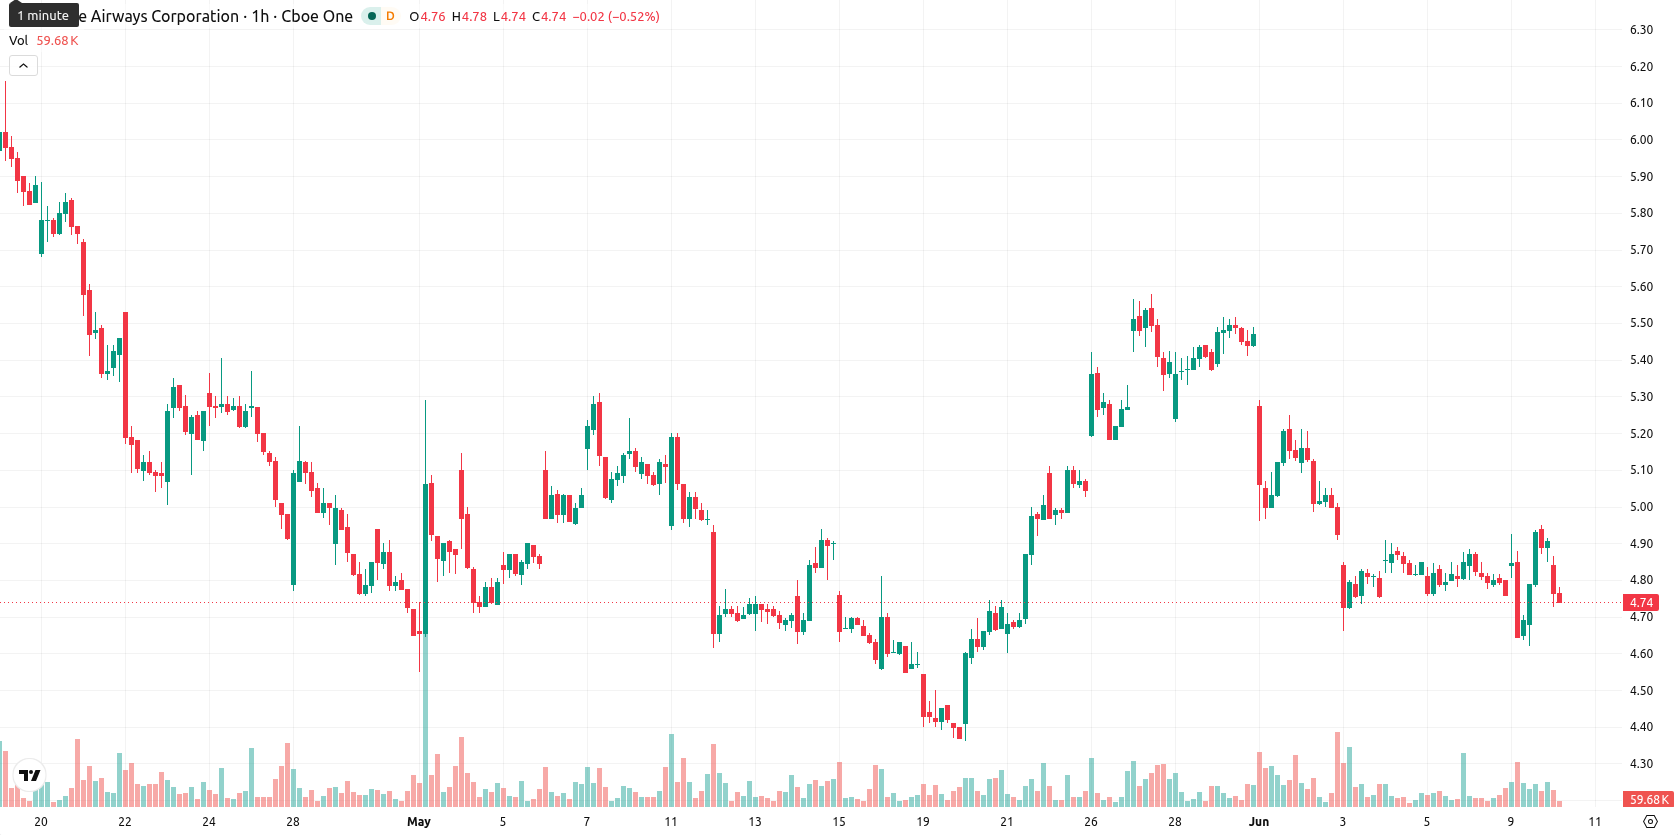
JetBlue Airways (JBLU) stock is trading at $4.76, down 3.25% for the session and closing near the low of the day. The stock remains below its key moving averages, signaling persistent downside interest on multiple timeframes.
Highlights
- JBLU price remains under sustained bearish pressure as it trades below short-, medium-, and long-term moving averages.
- Technical momentum is weak, with multiple indicators signaling a strong sell and a negative intraday price gap.
- Price is expected to consolidate between $4.61 and $5.16 over the next few days, with a bearish scenario favored unless $4.79 resistance is reclaimed.
Bearish signals persist as short-term support diverges from momentum
On the H1 chart, JBLU is below the MA-20 ($4.81), MA-50 ($4.88), and MA-200 ($4.90), while the Ichimoku Kijun sits at $4.79 as immediate resistance. The MACD and Stoch RSI both issue Strong Sell signals, with the ADX indicating a Sell trend and the RSI at 47.68 reflecting mild downside bias without oversold conditions. CCI is neutral, BBP suggests intraday buyer presence, and the Awesome Oscillator signals Strong Buy—highlighting divergence between short-term support and the broader bearish momentum.
Range-bound outlook holds as breakout risks remain asymmetric
Over the next 2–3 sessions, JBLU is expected to fluctuate between $4.61 and $5.16, consistent with typical volatility bands for the period. There is a 32% probability of an upward breakout, versus a 68% likelihood of a move lower. The most probable scenario is continued range-bound trading, with a close watch on $4.79 (immediate resistance) and $4.61 (key support) to define short-term direction.
Earlier, analysts noted that JetBlue’s outlook was clouded by industry headwinds and signaled continued consolidation amid heightened volatility and cost pressures. The current technical setup, with bearish momentum prevailing and resistance at $4.79, reinforces expectations for range-bound trading and places added importance on potential downside risks if support at $4.61 is breached.


-
 Afghanistan
-
 Albania
-
 Algeria
-
 Angola
-
 Argentina
-
 Armenia
-
 Australia
-
 Austria
-
 Azerbaijan
-
 Bahamas
-
 Bahrain
-
 Bangladesh
-
 Belarus
-
 Belgium
-
 Bolivia
-
 Botswana
-
 Brazil
-
 Brunei
-
 Bulgaria
-
 Cambodia
-
 Cameroon
-
 Canada
-
 Chile
Chile
-
 China
China
-
 Colombia
-
 Congo
Congo
-
 Costa Rica
-
 Cote d'Ivoire
-
 Croatia
-
 Cuba
Cuba
-
 Cyprus
-
 Czechia
-
 DR Congo
-
 Denmark
-
 Dominican Republic
-
 Ecuador
-
 Egypt
Egypt
-
 El Salvador
-
 Estonia
-
 Eswatini
-
 Ethiopia
-
 Finland
-
 France
-
 Georgia
-
 Germany
-
 Ghana
Ghana
-
 Greece
-
 Haiti
Haiti
-
 Hong Kong
-
 Hungary
-
 India
India
-
 Indonesia
-
 Iran, Islamic republic
-
 Iraq
Iraq
-
 Ireland
-
 Israel
-
 Italy
Italy
-
 Jamaica
-
 Japan
Japan
-
 Jordan
-
 Kazakhstan
-
 Kenya
Kenya
-
 Korea
Korea
-
 Kuwait
-
 Kyrgyzstan
-
 Laos
Laos
-
 Latvia
-
 Lebanon
-
 Lesotho
-
 Libya
Libya
-
 Lithuania
-
 Luxembourg
-
 Madagascar
-
 Malaysia
-
 Malta
Malta
-
 Mauritius
-
 Mexico
-
 Moldova
-
 Mongolia
-
 Montenegro
-
 Morocco
-
 Mozambique
-
 Myanmar
-
 Namibia
-
 Nepal
Nepal
-
 Netherlands
-
 New Zealand
-
 Nigeria
-
 North Macedonia
-
 Norway
-
 Oman
Oman
-
 Pakistan
-
 Palestine
-
 Panama
-
 Papua New Guinea
-
 Paraguay
-
 Peru
Peru
-
 Philippines
-
 Poland
-
 Portugal
-
 Puerto Rico
-
 Qatar
Qatar
-
 Reunion
-
 Romania
-
 Rwanda
-
 Saudi Arabia
-
 Serbia
-
 Singapore
-
 Slovakia
-
 Slovenia
-
 Somalia
-
 South Africa
-
 Spain
Spain
-
 Sri Lanka
-
 Sweden
-
 Switzerland
-
 Syria
Syria
-
 Taiwan
-
 Tajikistan
-
 Tanzania
-
 Thailand
-
 Trinidad and Tobago
-
 Tunisia
-
 Turkey
-
 UAE
UAE
-
 Uganda
-
 Ukraine
-
 United Kingdom
-
United States
-
 Uruguay
-
 Uzbekistan
-
 Venezuela
-
 Vietnam
-
 Yemen
Yemen
-
 Zambia
-
 Zimbabwe
- Forex
- Crypto
