
Interactive Brokers stock rallies 5.28% as mixed technical signals drive sharp intraday volatility

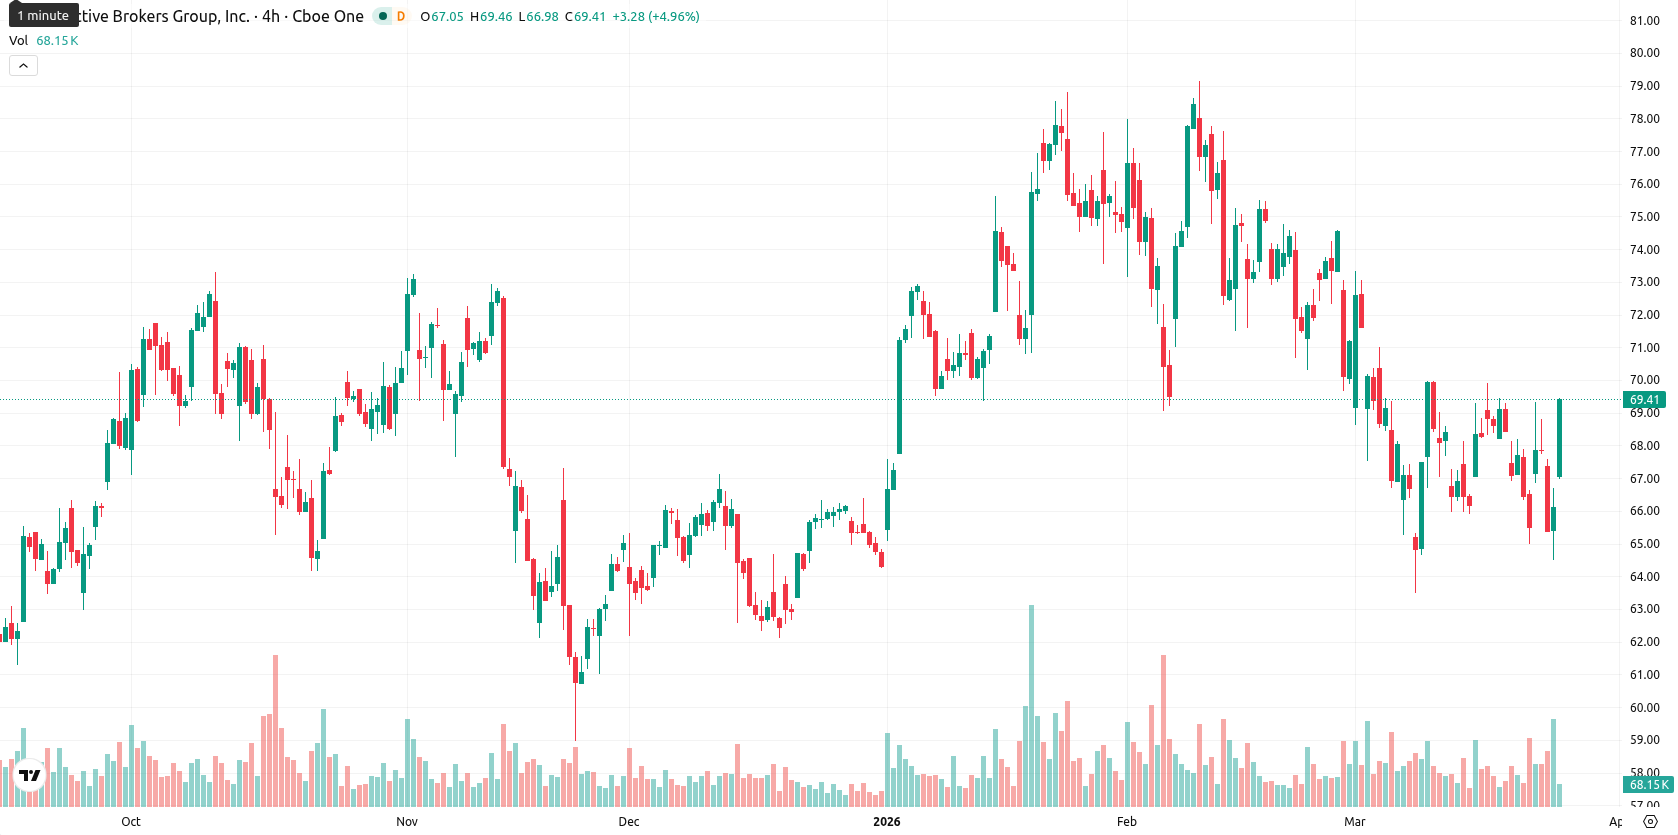
Interactive Brokers Group, Inc. (IBKR) is trading at $69.61, posting a strong daily gain of 5.28%. The price currently sits above both the MA-20 ($68.72) and MA-200 ($65.85), but remains below the MA-50 ($72.01), suggesting a near-term recovery from longer-term support, while medium-term sellers are still in control.
Highlights
- IBKR's price surged over 5% intraday, approaching the session high, signaling robust buying despite broader mixed momentum.
- Mixed technical indicators reflect short-term exhaustion and seller dominance, with momentum signals mostly bearish or neutral.
- IBKR is expected to consolidate between $66.00 and $72.00 over the next five days, with higher probability of a decline if bearish momentum persists.
Volatility persists amid weak trend and bearish momentum signals
Technically, IBKR is finding immediate support near the Ichimoku Kijun on the daily chart at $69.49, just below the current price. Daily momentum signals are mixed: MACD remains mildly bearish, with a negative value and sell forecast, while ADX is low at 14.84, indicating a weak trend. Oscillators also reflect indecision — RSI is in the neutral-sell range, both CCI and BBP register as oversold and point to seller dominance, and Stoch RSI signals strong sell pressure, confirming short-term exhaustion. Today’s gap up from $66.12 to $67.15 and price action near the daily high ($69.42) highlight elevated intraday volatility and sustained strength following the open.
Consolidation likely as downside risk outpaces upside potential
For the next five trading days, the expected price range based on typical IBKR volatility is $66.00 to $72.00. The probability of a price increase is very low (less than 20%), making a decline more likely. Baseline expectation is for the price to consolidate between recent support and resistance levels. If momentum strengthens intraday and the broader market improves, a break above $72.00 may prompt further short covering, while a fall below $66.00 could accelerate, targeting lower moving averages as the next supports.
Earlier, analysts noted that Interactive Brokers was experiencing persistent selling pressure and uncertain momentum, reflecting a cautious market stance. The current rebound highlights increased volatility and a shift in short-term sentiment, but traders should watch for confirmation of either continued recovery above $72.00 or renewed downside if support at $66.00 fails.


Latest Interactive Brokers News


-
 Afghanistan
-
 Albania
-
 Algeria
-
 Angola
-
 Argentina
-
 Armenia
-
 Australia
-
 Austria
-
 Azerbaijan
-
 Bahamas
-
 Bahrain
-
 Bangladesh
-
 Belarus
-
 Belgium
-
 Bolivia
-
 Botswana
-
 Brazil
-
 Brunei
-
 Bulgaria
-
 Cambodia
-
 Cameroon
-
 Canada
-
 Chile
Chile
-
 China
China
-
 Colombia
-
 Congo
Congo
-
 Costa Rica
-
 Cote d'Ivoire
-
 Croatia
-
 Cuba
Cuba
-
 Cyprus
-
 Czechia
-
 DR Congo
-
 Denmark
-
 Dominican Republic
-
 Ecuador
-
 Egypt
Egypt
-
 El Salvador
-
 Estonia
-
 Eswatini
-
 Ethiopia
-
 Finland
-
 France
-
 Georgia
-
 Germany
-
 Ghana
Ghana
-
 Greece
-
 Haiti
Haiti
-
 Hong Kong
-
 Hungary
-
 India
India
-
 Indonesia
-
 Iran, Islamic republic
-
 Iraq
Iraq
-
 Ireland
-
 Israel
-
 Italy
Italy
-
 Jamaica
-
 Japan
Japan
-
 Jordan
-
 Kazakhstan
-
 Kenya
Kenya
-
 Korea
Korea
-
 Kuwait
-
 Kyrgyzstan
-
 Laos
Laos
-
 Latvia
-
 Lebanon
-
 Lesotho
-
 Libya
Libya
-
 Lithuania
-
 Luxembourg
-
 Madagascar
-
 Malaysia
-
 Malta
Malta
-
 Mauritius
-
 Mexico
-
 Moldova
-
 Mongolia
-
 Montenegro
-
 Morocco
-
 Mozambique
-
 Myanmar
-
 Namibia
-
 Nepal
Nepal
-
 Netherlands
-
 New Zealand
-
 Nigeria
-
 North Macedonia
-
 Norway
-
 Oman
Oman
-
 Pakistan
-
 Palestine
-
 Panama
-
 Papua New Guinea
-
 Paraguay
-
 Peru
Peru
-
 Philippines
-
 Poland
-
 Portugal
-
 Puerto Rico
-
 Qatar
Qatar
-
 Reunion
-
 Romania
-
 Rwanda
-
 Saudi Arabia
-
 Serbia
-
 Singapore
-
 Slovakia
-
 Slovenia
-
 Somalia
-
 South Africa
-
 Spain
Spain
-
 Sri Lanka
-
 Sweden
-
 Switzerland
-
 Syria
Syria
-
 Taiwan
-
 Tajikistan
-
 Tanzania
-
 Thailand
-
 Trinidad and Tobago
-
 Tunisia
-
 Turkey
-
 UAE
UAE
-
 Uganda
-
 Ukraine
-
 United Kingdom
-
United States
-
 Uruguay
-
 Uzbekistan
-
 Venezuela
-
 Vietnam
-
 Yemen
Yemen
-
 Zambia
-
 Zimbabwe
- Forex
- Crypto
