
Alphabet stock holds steady as clean energy data center investment in India draws attention

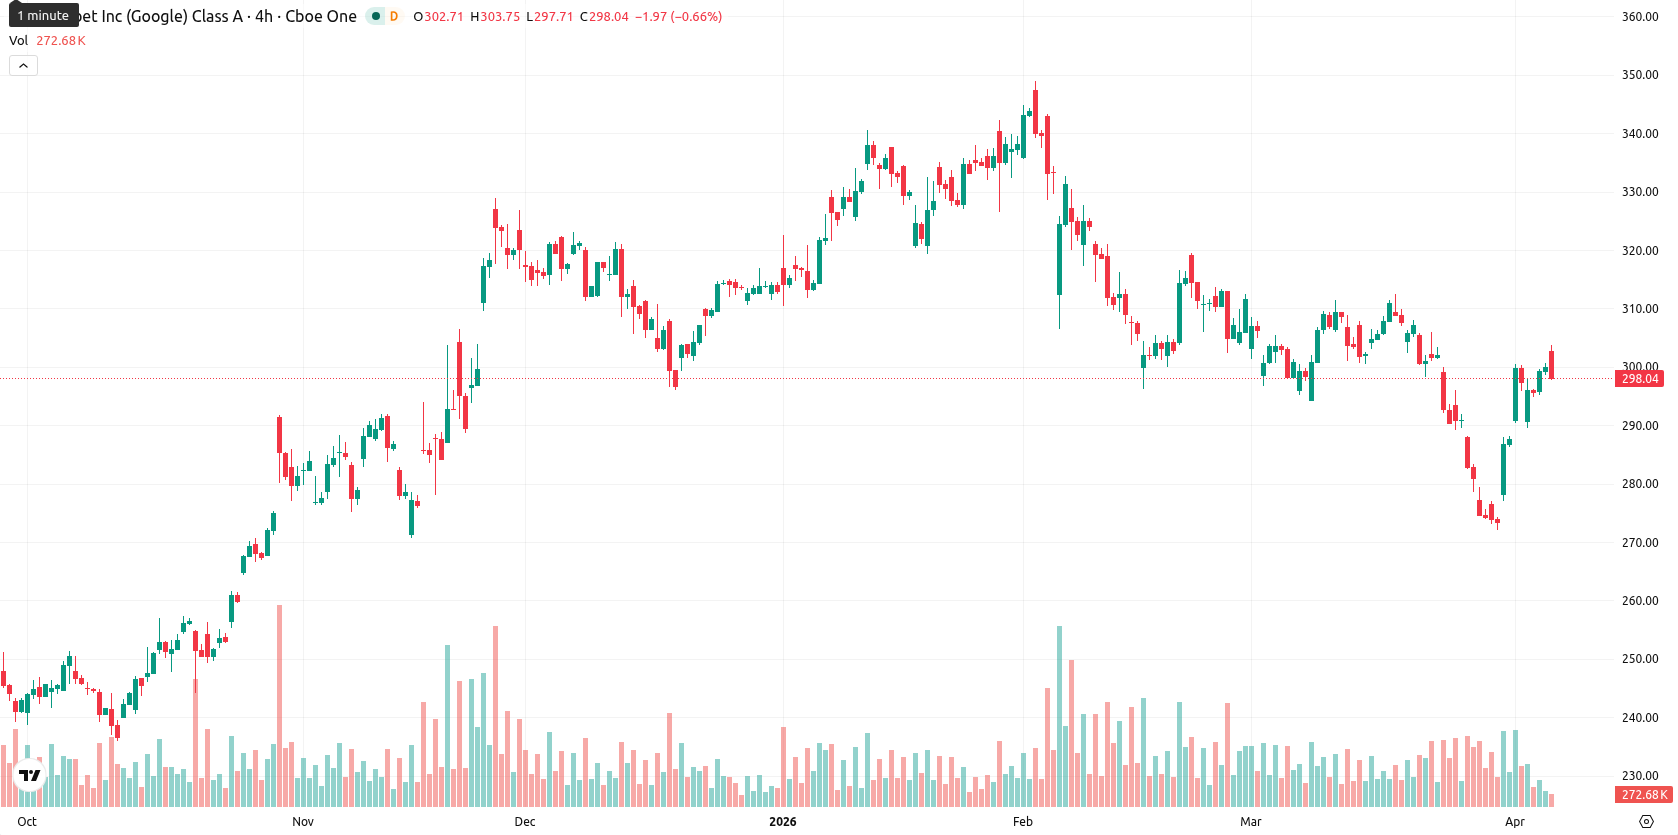
Alphabet Inc. (GOOGL) is trading at $299.78, a slight decrease of 0.04% for the day. The price remains above the SMA-20 ($297.66) but is positioned below the SMA-50 ($309.81), indicating that while short-term momentum is positive, intermediate resistance persists; the asset stays solidly above the SMA-200 ($265.61), which underscores long-term support.
Highlights
- Alphabet exceeded Q4 2025 revenue forecasts with $113.83 billion and announced a quarterly dividend payable March 16.
- A $15 billion clean energy data center investment in India and new AI/Cloud partnerships signal intensified focus on global AI infrastructure.
- GOOGL trades near short-term resistance with overbought signals; consolidation expected between $298.55 and $302.88 barring a technical breakout.
Revenue beat and cloud gains as investment lifts strategic outlook
Alphabet reported fourth-quarter 2025 revenue of $113.83 billion, surpassing analyst expectations, and issued a quarterly dividend paid on March 16. The company announced a $15 billion investment in a clean energy-powered data center in India through its partnership with Adani Group, aimed at boosting AI infrastructure and cloud services. Recent developments also included the launch of an offline-first AI speech-to-text app and a long-term custom AI chip agreement with Broadcom, as well as strong Google Cloud growth driven by the new TurboQuant compression algorithm, though price action has remained under broader selling pressure.
Oscillators flag overbought risk as momentum wanes at resistance
Technically, GOOGL trades above the Ichimoku Kijun level on D1 ($292.29), providing immediate support. MACD on the daily chart signals strong selling and the ADX indicates trend weakness, but RSI is near neutral-bullish, with Stoch RSI and BBP both flagging overbought as buyers hold session control. The CCI is neutral, and the Awesome Oscillator gives limited trend confirmation. The session began with a slight upward gap from $299.90 to $302.65 but retreated to $299.78, staying mid-range ($298.95–$303.04) amid low volatility and mild downward pressure. Several oscillators now warn of overbought conditions while medium-term momentum weakens, highlighting possible short-term exhaustion.
Consolidation expected as buy signals dominate weekly outlook
Looking ahead, the typical volatility band for the coming week is expected between $298.55 and $302.88. Multiple weekly indicators, including moving averages, MACD, ADX, and RSI, give strong buy signals and suggest over an 80% probability of upward movement. The base scenario sees GOOGL consolidating between immediate support and resistance. A break above $302.88 could signal renewed bullish momentum, while a move under $298.55 may see further downside and profit-taking.
Earlier, analysts noted that Alphabet's recent declines were likely corrective and suggested longer-term optimism for the stock. Current technicals and positive fundamental developments strengthen this outlook, but traders should closely monitor the $302.88 resistance level for signs of renewed bullish momentum or potential reversal.


Latest Google News


-
 Afghanistan
-
 Albania
-
 Algeria
-
 Angola
-
 Argentina
-
 Armenia
-
 Australia
-
 Austria
-
 Azerbaijan
-
 Bahamas
-
 Bahrain
-
 Bangladesh
-
 Belarus
-
 Belgium
-
 Bolivia
-
 Botswana
-
 Brazil
-
 Brunei
-
 Bulgaria
-
 Cambodia
-
 Cameroon
-
 Canada
-
 Chile
Chile
-
 China
China
-
 Colombia
-
 Congo
Congo
-
 Costa Rica
-
 Cote d'Ivoire
-
 Croatia
-
 Cuba
Cuba
-
 Cyprus
-
 Czechia
-
 DR Congo
-
 Denmark
-
 Dominican Republic
-
 Ecuador
-
 Egypt
Egypt
-
 El Salvador
-
 Estonia
-
 Eswatini
-
 Ethiopia
-
 Finland
-
 France
-
 Georgia
-
 Germany
-
 Ghana
Ghana
-
 Greece
-
 Haiti
Haiti
-
 Hong Kong
-
 Hungary
-
 India
India
-
 Indonesia
-
 Iran, Islamic republic
-
 Iraq
Iraq
-
 Ireland
-
 Israel
-
 Italy
Italy
-
 Jamaica
-
 Japan
Japan
-
 Jordan
-
 Kazakhstan
-
 Kenya
Kenya
-
 Korea
Korea
-
 Kuwait
-
 Kyrgyzstan
-
 Laos
Laos
-
 Latvia
-
 Lebanon
-
 Lesotho
-
 Libya
Libya
-
 Lithuania
-
 Luxembourg
-
 Madagascar
-
 Malaysia
-
 Malta
Malta
-
 Mauritius
-
 Mexico
-
 Moldova
-
 Mongolia
-
 Montenegro
-
 Morocco
-
 Mozambique
-
 Myanmar
-
 Namibia
-
 Nepal
Nepal
-
 Netherlands
-
 New Zealand
-
 Nigeria
-
 North Macedonia
-
 Norway
-
 Oman
Oman
-
 Pakistan
-
 Palestine
-
 Panama
-
 Papua New Guinea
-
 Paraguay
-
 Peru
Peru
-
 Philippines
-
 Poland
-
 Portugal
-
 Puerto Rico
-
 Qatar
Qatar
-
 Reunion
-
 Romania
-
 Rwanda
-
 Saudi Arabia
-
 Serbia
-
 Singapore
-
 Slovakia
-
 Slovenia
-
 Somalia
-
 South Africa
-
 Spain
Spain
-
 Sri Lanka
-
 Sweden
-
 Switzerland
-
 Syria
Syria
-
 Taiwan
-
 Tajikistan
-
 Tanzania
-
 Thailand
-
 Trinidad and Tobago
-
 Tunisia
-
 Turkey
-
 UAE
UAE
-
 Uganda
-
 Ukraine
-
 United Kingdom
-
United States
-
 Uruguay
-
 Uzbekistan
-
 Venezuela
-
 Vietnam
-
 Yemen
Yemen
-
 Zambia
-
 Zimbabwe
- Forex
- Crypto
