
PayPal stock price forecast: $45.50 to $46.80 range watched as PYPL advances 3.26%

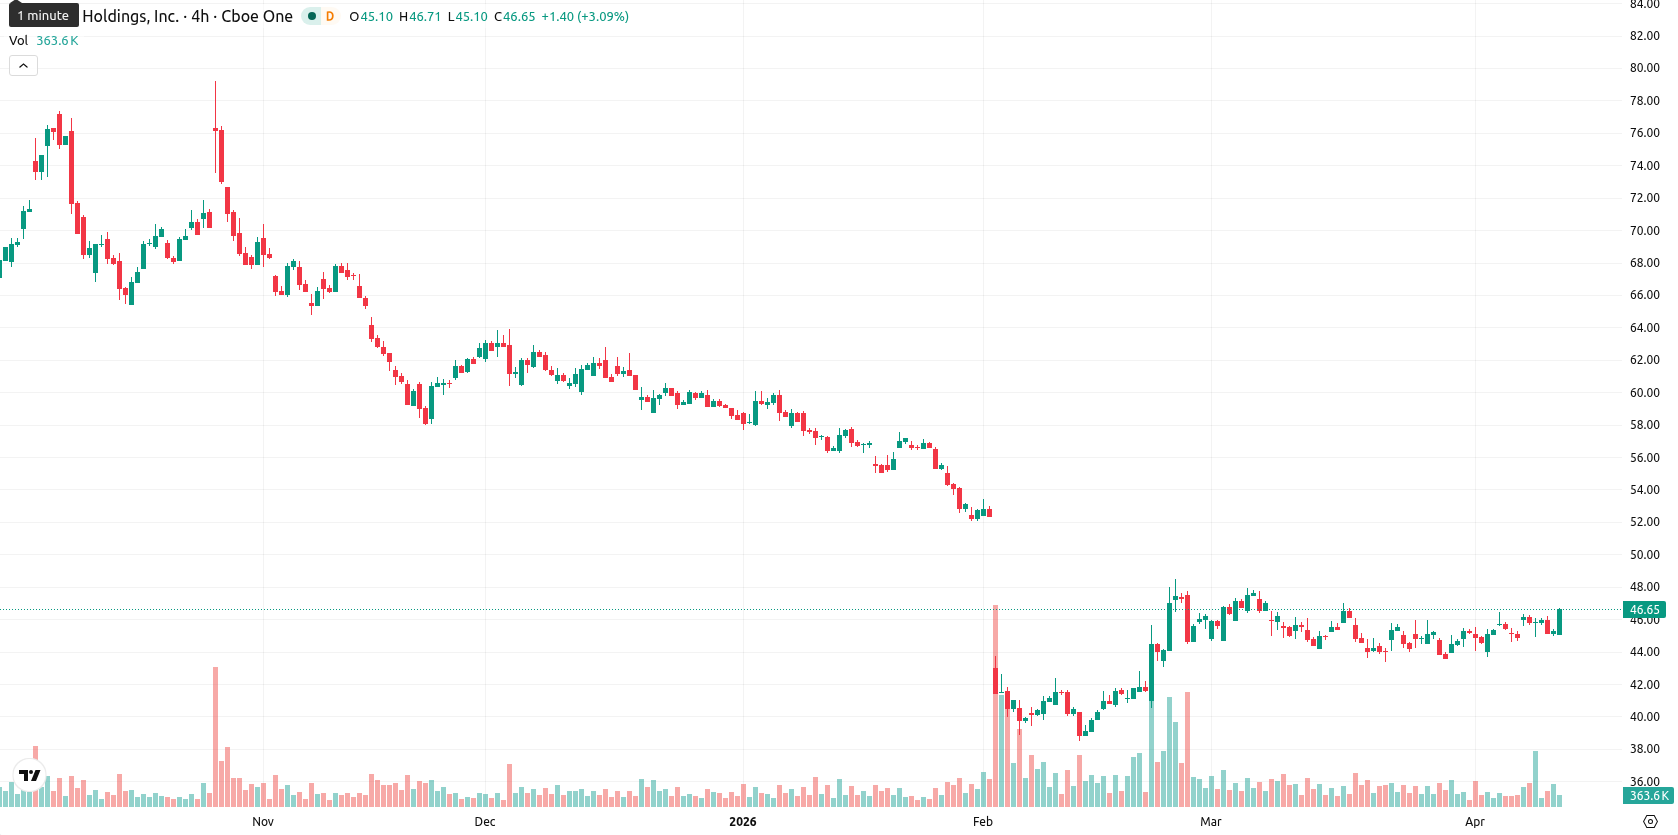
PayPal Holdings, Inc. (PYPL) is trading at $46.73, gaining 3.26% on the day. The stock sits above both its 20-day ($45.00) and 50-day ($44.68) simple moving averages but remains well below the 200-day SMA at $61.11, highlighting short- and medium-term upward momentum within a longer-term bearish trend.
 44.60
46.06
44.60
46.06
Highlights
- PayPal faces an active securities fraud class action alleging misleading disclosures on its salesforce and growth outlook between February 2024 and February 2026.
- Management turmoil continued with a surprise CEO change, announced alongside disappointing Q4 and full-year 2025 earnings misses.
- Technicals show short- and medium-term upward pressure is fragile, with price expected to consolidate between $45.50 and $46.80 next week amid weak momentum signals.
Class action pressures sentiment after CEO exit and earnings miss
On April 13, 2026, shareholders of PayPal were reminded of an ongoing securities fraud class action lawsuit, with law firms alleging that the company and its executives made false or misleading statements about PayPal’s salesforce and growth prospects. This follows PayPal’s surprise CEO change announced on February 3, 2026, which coincided with fourth quarter and full-year 2025 earnings that missed consensus estimates for both revenue and profit. The class action covers investors who purchased common stock between February 8, 2024, and February 2, 2026, with a court deadline set for April 20, 2026.
Mixed momentum signals as technical boundaries contain price
Technically, PYPL is trading above the SMA-20 and SMA-50, indicating short- and medium-term upward pressure; however, it is still well below the SMA-200, suggesting the longer-term bias remains bearish. The Ichimoku Kijun support at $45.63 is just beneath the current price. MACD reflects strong bearish momentum, and ADX on the daily chart shows weak trend strength. RSI is mid-range with a sell signal, CCI points to buy, and Stoch RSI indicates a strong sell, producing mixed momentum signals, while BBP shows an overbought condition dominated by buyers and the Awesome Oscillator also flashes a buy signal. Price action near the daily high with no significant gap at the open underscores moderate intraday volatility, but momentum remains fragile as some indicators do not confirm the move higher.
Sideways trade likely as breakout risks remain subdued
Over the next week, PYPL is expected to fluctuate within a volatility band of $45.50 to $46.80, consistent with its recent price action and typical volatility. Technical signals do not favor a near-term breakout, with less than a 20% probability of a material price increase based on current momentum and trend indicators. The most likely scenario is continued sideways consolidation near support and resistance levels. A sustained move above $46.80 could attract buyers, while a break below $45.50 would expose the stock to further downside amid limited medium-term support.
Earlier, analysts noted that PayPal was experiencing sustained bearish momentum and remained hindered by ongoing legal challenges, contributing to a cautious medium-term outlook. With the stock now showing short-term strength above key moving averages yet facing heightened volatility from unresolved litigation and a recent executive shakeup, traders should closely monitor for any decisive move beyond the $46.80 resistance or breakdown below $45.50 as a signal for potential trend reversal.













-
 Afghanistan
-
 Albania
-
 Algeria
-
 Angola
-
 Argentina
-
 Armenia
-
 Australia
-
 Austria
-
 Azerbaijan
-
 Bahamas
-
 Bahrain
-
 Bangladesh
-
 Belarus
-
 Belgium
-
 Bolivia
-
 Botswana
-
 Brazil
-
 Brunei
-
 Bulgaria
-
 Cambodia
-
 Cameroon
-
 Canada
-
 Chile
Chile
-
 China
China
-
 Colombia
-
 Congo
Congo
-
 Costa Rica
-
 Cote d'Ivoire
-
 Croatia
-
 Cuba
Cuba
-
 Cyprus
-
 Czechia
-
 DR Congo
-
 Denmark
-
 Dominican Republic
-
 Ecuador
-
 Egypt
Egypt
-
 El Salvador
-
 Estonia
-
 Eswatini
-
 Ethiopia
-
 Finland
-
 France
-
 Georgia
-
 Germany
-
 Ghana
Ghana
-
 Greece
-
 Haiti
Haiti
-
 Hong Kong
-
 Hungary
-
 India
India
-
 Indonesia
-
 Iran, Islamic republic
-
 Iraq
Iraq
-
 Ireland
-
 Israel
-
 Italy
Italy
-
 Jamaica
-
 Japan
Japan
-
 Jordan
-
 Kazakhstan
-
 Kenya
Kenya
-
 Korea
Korea
-
 Kuwait
-
 Kyrgyzstan
-
 Laos
Laos
-
 Latvia
-
 Lebanon
-
 Lesotho
-
 Libya
Libya
-
 Lithuania
-
 Luxembourg
-
 Madagascar
-
 Malaysia
-
 Malta
Malta
-
 Mauritius
-
 Mexico
-
 Moldova
-
 Mongolia
-
 Montenegro
-
 Morocco
-
 Mozambique
-
 Myanmar
-
 Namibia
-
 Nepal
Nepal
-
 Netherlands
-
 New Zealand
-
 Nigeria
-
 North Macedonia
-
 Norway
-
 Oman
Oman
-
 Pakistan
-
 Palestine
-
 Panama
-
 Papua New Guinea
-
 Paraguay
-
 Peru
Peru
-
 Philippines
-
 Poland
-
 Portugal
-
 Puerto Rico
-
 Qatar
Qatar
-
 Reunion
-
 Romania
-
 Rwanda
-
 Saudi Arabia
-
 Serbia
-
 Singapore
-
 Slovakia
-
 Slovenia
-
 Somalia
-
 South Africa
-
 Spain
Spain
-
 Sri Lanka
-
 Sweden
-
 Switzerland
-
 Syria
Syria
-
 Taiwan
-
 Tajikistan
-
 Tanzania
-
 Thailand
-
 Trinidad and Tobago
-
 Tunisia
-
 Turkey
-
 UAE
UAE
-
 Uganda
-
 Ukraine
-
 United Kingdom
-
United States
-
 Uruguay
-
 Uzbekistan
-
 Venezuela
-
 Vietnam
-
 Yemen
Yemen
-
 Zambia
-
 Zimbabwe
- Forex
- Crypto











