

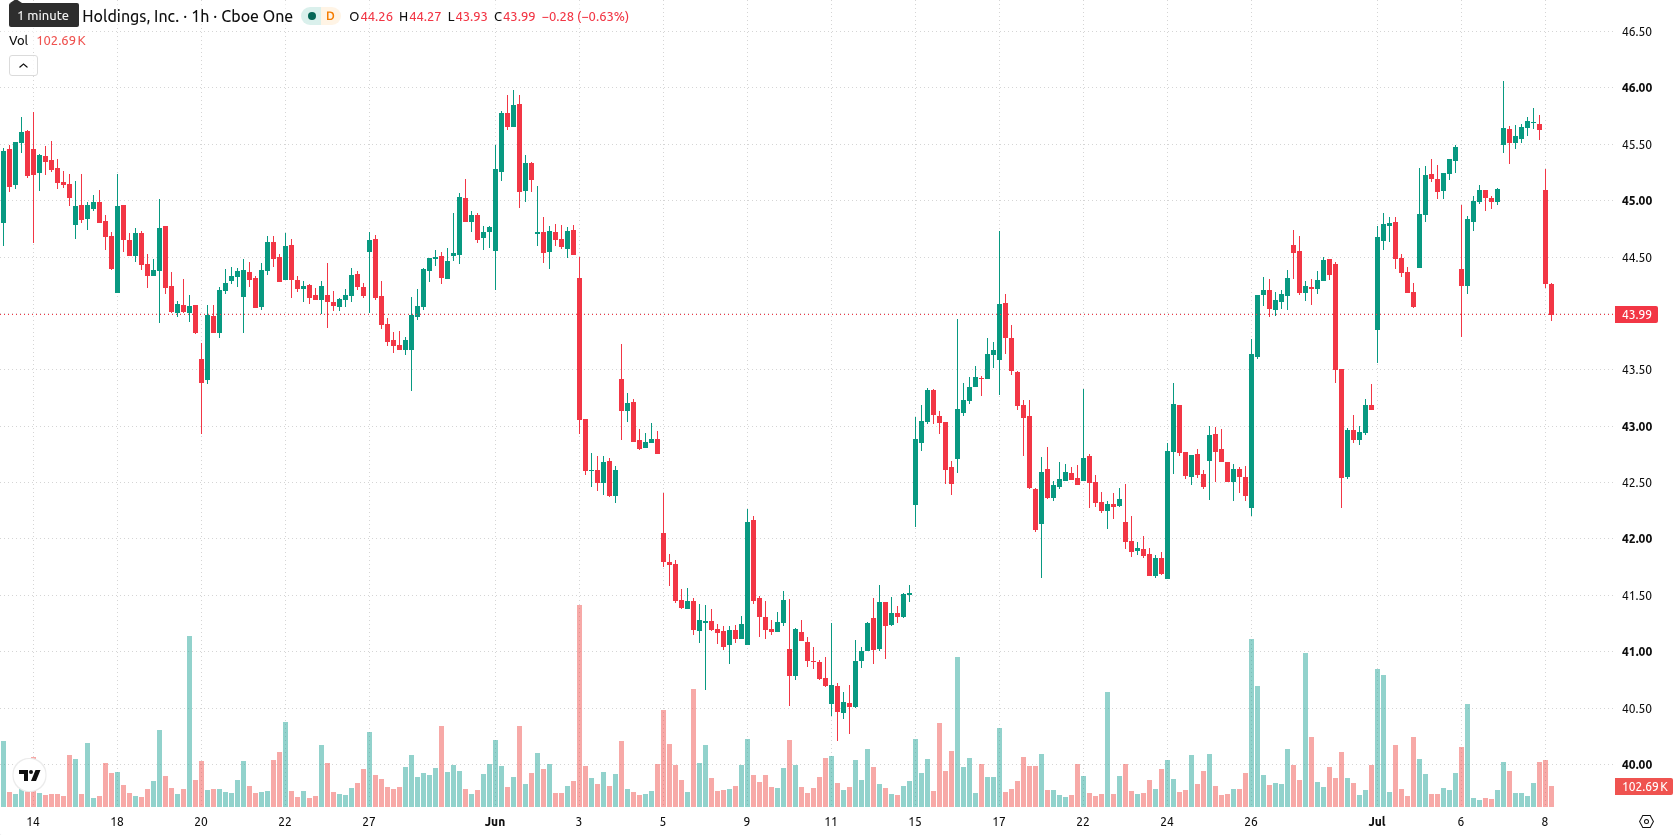
PayPal Holdings, Inc. (PYPL) stock is trading at $44.1, exhibiting a daily decline of 3.36%. The price currently sits below its key moving averages, reflecting broad-based selling interest.
 44.60
46.06
44.60
46.06
Highlights
- PYPL/USD remains under sustained selling pressure, trading below all key moving averages across timeframes.
- Oscillator signals are mixed, showing overbought intraday conditions despite a pronounced daily price drop and weak trend strength.
- Expected trading range for the next 2–3 days is $43.19 to $45.92, with a 77% probability of an upward move if $44.92 resistance is breached.
Technical signals diverge as resistance firms amid low volatility
On the technical front, PYPL/USD is trading below the MA-20 at $45.26 and MA-50 at $44.48 on the hourly chart, and remains well under the long-term MA-200 at $53.55. The Ichimoku Kijun sits at $44.92 and has emerged as a resistance level. The Moving Average Convergence Divergence (MACD) holds in buy territory, while the Relative Strength Index (RSI) is elevated at 61.71. However, the Average Directional Index (ADX) reads neutral, Stochastic RSI is overbought, and the Commodity Channel Index (CCI) signals buy. Bull/Bear Power shows buyers dominating intraday, but the Awesome Oscillator does not confirm clear momentum. This mixed landscape is compounded by low volatility and noticeable divergence between overbought oscillators and the day’s price drop.
Bulls eye breakout while range trade remains dominant
Looking ahead to the next two to three trading days, the price is expected to fluctuate within a range of $43.19 to $45.92. The probability of an upward move is estimated at 77%, with a 23% chance of further decline. A range-bound scenario is most likely; if bullish momentum builds and resistance at $44.92 is decisively breached, a move toward the higher end of this volatility band is plausible. Conversely, if the $43.19 support level fails to hold, additional downside could develop.
Earlier, analysts noted that PayPal’s structural repositioning and improved momentum signaled the potential for continued short-term strength. However, the current shift below key moving averages alongside mixed technical signals adds a layer of caution, with traders advised to watch for a decisive move above $44.92 or below $43.19 to confirm the next directional bias.













-
 Afghanistan
-
 Albania
-
 Algeria
-
 Angola
-
 Argentina
-
 Armenia
-
 Australia
-
 Austria
-
 Azerbaijan
-
 Bahamas
-
 Bahrain
-
 Bangladesh
-
 Belarus
-
 Belgium
-
 Bolivia
-
 Botswana
-
 Brazil
-
 Brunei
-
 Bulgaria
-
 Cambodia
-
 Cameroon
-
 Canada
-
 Chile
Chile
-
 China
China
-
 Colombia
-
 Congo
Congo
-
 Costa Rica
-
 Cote d'Ivoire
-
 Croatia
-
 Cuba
Cuba
-
 Cyprus
-
 Czechia
-
 DR Congo
-
 Denmark
-
 Dominican Republic
-
 Ecuador
-
 Egypt
Egypt
-
 El Salvador
-
 Estonia
-
 Eswatini
-
 Ethiopia
-
 Finland
-
 France
-
 Georgia
-
 Germany
-
 Ghana
Ghana
-
 Greece
-
 Haiti
Haiti
-
 Hong Kong
-
 Hungary
-
 India
India
-
 Indonesia
-
 Iran, Islamic republic
-
 Iraq
Iraq
-
 Ireland
-
 Israel
-
 Italy
Italy
-
 Jamaica
-
 Japan
Japan
-
 Jordan
-
 Kazakhstan
-
 Kenya
Kenya
-
 Korea
Korea
-
 Kuwait
-
 Kyrgyzstan
-
 Laos
Laos
-
 Latvia
-
 Lebanon
-
 Lesotho
-
 Libya
Libya
-
 Lithuania
-
 Luxembourg
-
 Madagascar
-
 Malaysia
-
 Malta
Malta
-
 Mauritius
-
 Mexico
-
 Moldova
-
 Mongolia
-
 Montenegro
-
 Morocco
-
 Mozambique
-
 Myanmar
-
 Namibia
-
 Nepal
Nepal
-
 Netherlands
-
 New Zealand
-
 Nigeria
-
 North Macedonia
-
 Norway
-
 Oman
Oman
-
 Pakistan
-
 Palestine
-
 Panama
-
 Papua New Guinea
-
 Paraguay
-
 Peru
Peru
-
 Philippines
-
 Poland
-
 Portugal
-
 Puerto Rico
-
 Qatar
Qatar
-
 Reunion
-
 Romania
-
 Rwanda
-
 Saudi Arabia
-
 Serbia
-
 Singapore
-
 Slovakia
-
 Slovenia
-
 Somalia
-
 South Africa
-
 Spain
Spain
-
 Sri Lanka
-
 Sweden
-
 Switzerland
-
 Syria
Syria
-
 Taiwan
-
 Tajikistan
-
 Tanzania
-
 Thailand
-
 Trinidad and Tobago
-
 Tunisia
-
 Turkey
-
 UAE
UAE
-
 Uganda
-
 Ukraine
-
 United Kingdom
-
United States
-
 Uruguay
-
 Uzbekistan
-
 Venezuela
-
 Vietnam
-
 Yemen
Yemen
-
 Zambia
-
 Zimbabwe
- Forex
- Crypto











