
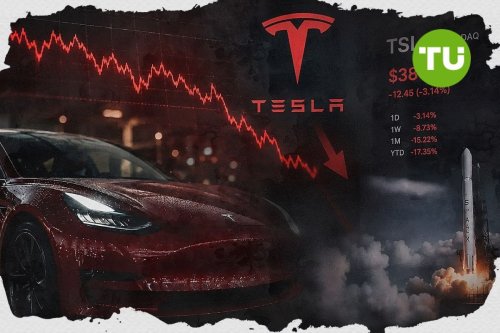
Full utilization of Chinese Working Capital Facility keeps Tesla stock trading flat

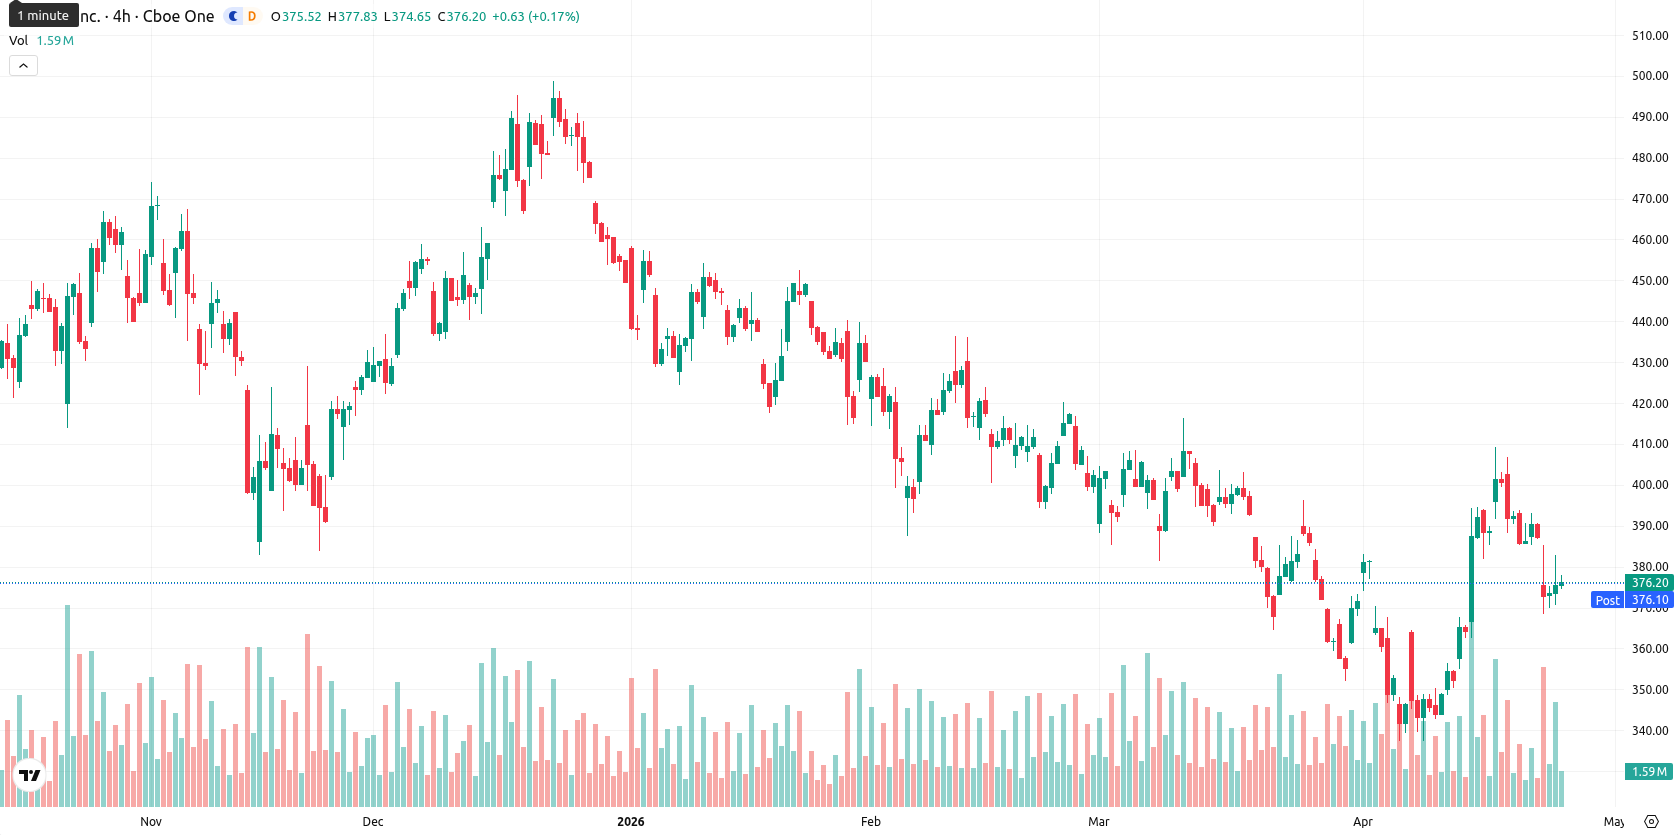
Tesla, Inc. (TSLA) is trading at $375.78, up 0.55% on the day and currently positioned above its short-term moving averages but below medium- and long-term averages.
Highlights
- Tesla delivered Q1 revenue of $22.39 billion and $0.41 EPS, surpassing analyst expectations on adjusted profit.
- The company raised full-year capital spending guidance above $25 billion, citing accelerated investments in AI, robotics, and an AI hardware acquisition up to $2 billion.
- Technicals indicate TSLA trades above short-term support amid mixed momentum and oscillators, with a projected five-day range of $368–$382 and downside risk prevailing.
Accelerated spending and AI deals reshape outlook following earnings beat
On April 23, 2026, Tesla reported first-quarter revenue of $22.39 billion and net income of $477 million, posting adjusted earnings per share of $0.41 that beat Wall Street estimates. The company revised its capital expenditure outlook upward to over $25 billion for the year, citing accelerated investments in AI, robotics, and new product lines including Optimus and Cybercab. Tesla disclosed an acquisition of an unnamed AI hardware company worth up to $2 billion in stock and announced a partnership with Intel for advanced chip manufacturing. Tesla also fully utilized its $5.8 billion Chinese Working Capital Facility following a 16% decline in China retail sales, and CEO Elon Musk outlined updates to its Full Self-Driving technology and upcoming releases.
Mixed momentum and overbought signals as price tests support levels
The price is currently trading above the SMA-20 ($368.88), below the SMA-50 ($388.10), and remains well under the SMA-200 ($400.44). Immediate support is provided by the Ichimoku Kijun level at $373.16. Momentum indicators are mixed: the MACD and ADX are neutral on the daily timeframe, the RSI stands at 47.32 with a 'Sell' signal, and the Stoch RSI and CCI both show neutral readings. Bull/Bear Power (BBP) is at 3.15 and flagged 'overbought', suggesting short-term buyer dominance, while the Awesome Oscillator does not exhibit a clear trend. Intraday volatility is moderate with the price fluctuating between $372.36 and $379.39, tracking a slight gap up from the previous session's close.
Downside risk prevails as volatility bands limit upward breakouts
For the next five trading days, TSLA is likely to see a typical volatility band between $368.00 and $382.00. The probability of a significant increase is very low (less than 20%), making additional downside moves more likely. TSLA may continue consolidating near immediate support, while a push above $380–$382 could trigger resistance breakouts and a test of the SMA-50. If the price weakens decisively below $370, further losses could follow in line with medium-term bearish signals.
Earlier, analysts noted that Tesla shares remained locked in sideways consolidation as growing reliance on Chinese financing and ongoing tariff uncertainties pressured sentiment. The latest earnings beat and expansion into AI hardware add new strategic drivers, but with momentum still mixed and volatility contained, traders should closely monitor for a breakout above the $382 resistance zone that could shift the short-term trend.


-
 Afghanistan
-
 Albania
-
 Algeria
-
 Angola
-
 Argentina
-
 Armenia
-
 Australia
-
 Austria
-
 Azerbaijan
-
 Bahamas
-
 Bahrain
-
 Bangladesh
-
 Belarus
-
 Belgium
-
 Bolivia
-
 Botswana
-
 Brazil
-
 Brunei
-
 Bulgaria
-
 Cambodia
-
 Cameroon
-
 Canada
-
 Chile
Chile
-
 China
China
-
 Colombia
-
 Congo
Congo
-
 Costa Rica
-
 Cote d'Ivoire
-
 Croatia
-
 Cuba
Cuba
-
 Cyprus
-
 Czechia
-
 DR Congo
-
 Denmark
-
 Dominican Republic
-
 Ecuador
-
 Egypt
Egypt
-
 El Salvador
-
 Estonia
-
 Eswatini
-
 Ethiopia
-
 Finland
-
 France
-
 Georgia
-
 Germany
-
 Ghana
Ghana
-
 Greece
-
 Haiti
Haiti
-
 Hong Kong
-
 Hungary
-
 India
India
-
 Indonesia
-
 Iran, Islamic republic
-
 Iraq
Iraq
-
 Ireland
-
 Israel
-
 Italy
Italy
-
 Jamaica
-
 Japan
Japan
-
 Jordan
-
 Kazakhstan
-
 Kenya
Kenya
-
 Korea
Korea
-
 Kuwait
-
 Kyrgyzstan
-
 Laos
Laos
-
 Latvia
-
 Lebanon
-
 Lesotho
-
 Libya
Libya
-
 Lithuania
-
 Luxembourg
-
 Madagascar
-
 Malaysia
-
 Malta
Malta
-
 Mauritius
-
 Mexico
-
 Moldova
-
 Mongolia
-
 Montenegro
-
 Morocco
-
 Mozambique
-
 Myanmar
-
 Namibia
-
 Nepal
Nepal
-
 Netherlands
-
 New Zealand
-
 Nigeria
-
 North Macedonia
-
 Norway
-
 Oman
Oman
-
 Pakistan
-
 Palestine
-
 Panama
-
 Papua New Guinea
-
 Paraguay
-
 Peru
Peru
-
 Philippines
-
 Poland
-
 Portugal
-
 Puerto Rico
-
 Qatar
Qatar
-
 Reunion
-
 Romania
-
 Rwanda
-
 Saudi Arabia
-
 Serbia
-
 Singapore
-
 Slovakia
-
 Slovenia
-
 Somalia
-
 South Africa
-
 Spain
Spain
-
 Sri Lanka
-
 Sweden
-
 Switzerland
-
 Syria
Syria
-
 Taiwan
-
 Tajikistan
-
 Tanzania
-
 Thailand
-
 Trinidad and Tobago
-
 Tunisia
-
 Turkey
-
 UAE
UAE
-
 Uganda
-
 Ukraine
-
 United Kingdom
-
United States
-
 Uruguay
-
 Uzbekistan
-
 Venezuela
-
 Vietnam
-
 Yemen
Yemen
-
 Zambia
-
 Zimbabwe
- Forex
- Crypto
