
Speculation of SpaceX merger adds uncertainty and pushes Tesla stock lower

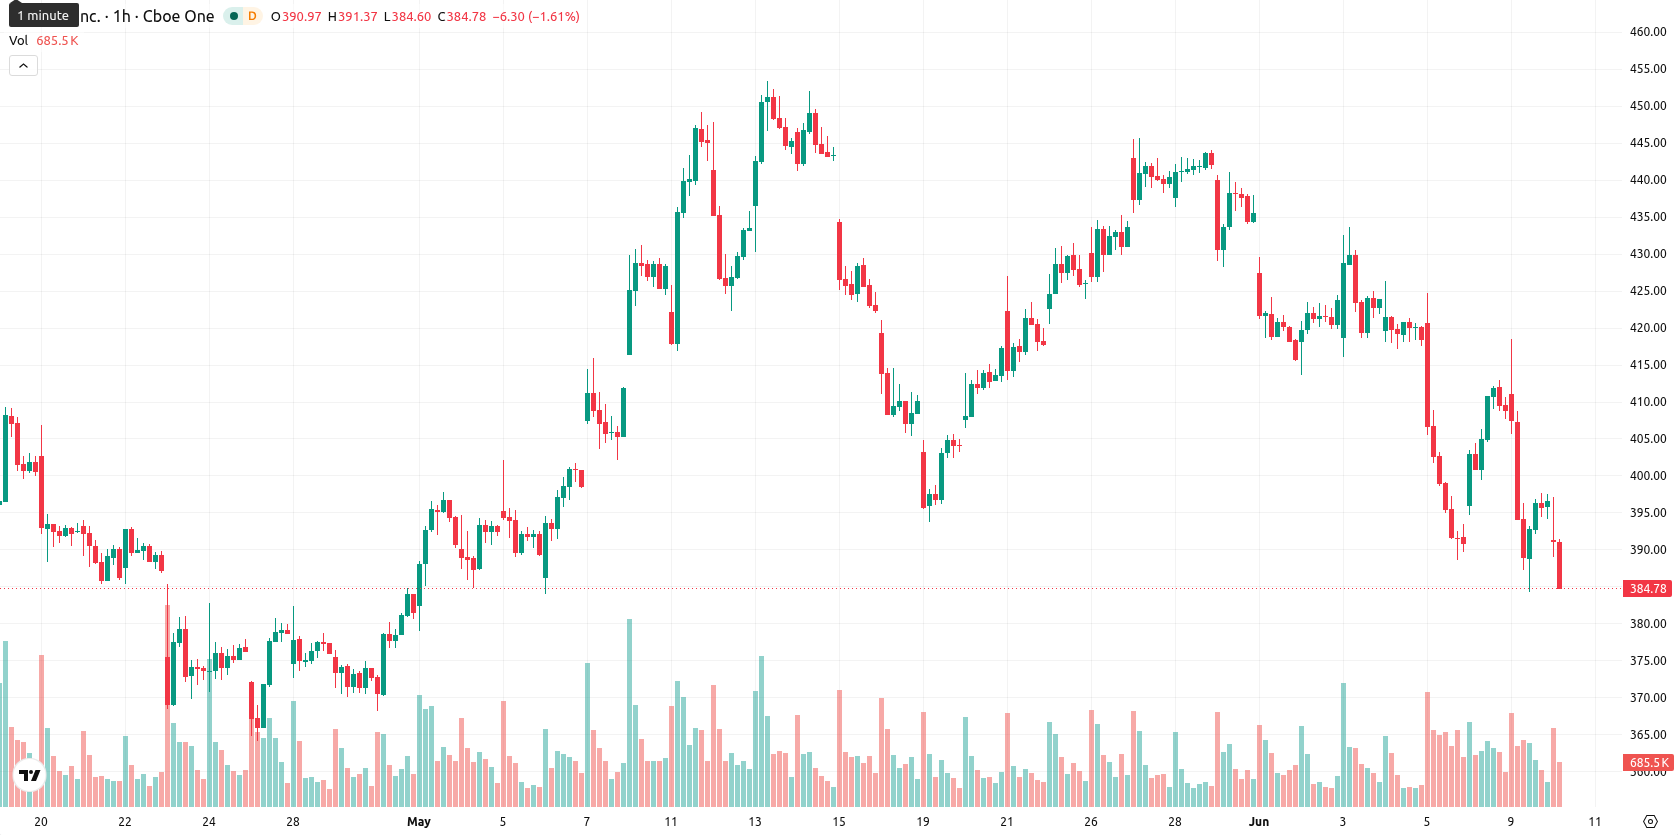
Tesla, Inc. (TSLA) stock is trading at $390.60, down 1.66% for the day and finishing near the session low. The price currently remains below its key short- and long-term moving averages, indicating sustained pressure from sellers.
Highlights
- Intensifying speculation about a potential Tesla–SpaceX merger following SpaceX S-1 amendments fuels elevated investor uncertainty and stock volatility.
- Tesla's data from the Netherlands shows its Full Self-Driving system had 3.5 times fewer collisions than manual driving over 23 million kilometers, offering incremental regulatory confidence but limited price impact.
- TSLA trades below key moving averages with bearish momentum signals, an expected trading range of $371.93 to $409.27, and a higher probability of further downside.
Merger rumors and institutional shifts drive investor uncertainty
Speculation regarding a potential Tesla and SpaceX merger intensified after amendments to SpaceX's S-1 filing and heightened merger discussions, though no formal proposal has been issued, introducing corporate uncertainty and contributing to volatile investor sentiment. Tesla also released new safety figures for its Full Self-Driving program in the Netherlands, evidencing 3.5 times fewer collisions than manual driving over a span exceeding 23 million kilometers, which may affect perceptions of regulatory progress but plays a secondary role in price action. Additionally, institutional disclosures from TIAA Trust National Association and Erste Asset Management GmbH revealed increased Tesla shareholdings, although these changes are modest compared to the impact from heightened merger-related ambiguity.
Mixed price signals amid multi-timeframe technical resistance
TSLA closed at $390.60, with the price remaining below the MA-20, MA-50, and MA-200, highlighting sellers' control across all timeframes. The Ichimoku Kijun level at $404.46 marks immediate resistance. Momentum indicators present a mixed technical profile: MACD shows a strong sell signal, ADX is neutral, RSI is at 42.29 and points to a sell, while Stoch RSI, CCI, and Awesome Oscillator are neutral. BBP signals intraday seller dominance, and the price closed near the daily low with a gap of 1.92.
Downside favored as range holds unless resistance is breached
Over the coming sessions, TSLA is expected to trade within a volatility band of $371.93 to $409.27. The probability favors a downside move, while a sustained rally is considered unlikely unless resistance at $404.46 is overcome. The primary scenario anticipates the stock stabilizing within this defined range; a bullish outcome would require a break above the Kijun level, whereas a drop below $371.93 could prompt accelerated downward momentum.
Earlier, analysts noted that Tesla was exhibiting medium-term selling pressure and a cautious outlook driven by both technical weakness and uncertainty from merger speculation. The current analysis reinforces and expands on this view by highlighting continued seller dominance across all timeframes and pointing to $371.93 as a critical downside level to monitor for potential acceleration in volatility.


-
 Afghanistan
-
 Albania
-
 Algeria
-
 Angola
-
 Argentina
-
 Armenia
-
 Australia
-
 Austria
-
 Azerbaijan
-
 Bahamas
-
 Bahrain
-
 Bangladesh
-
 Belarus
-
 Belgium
-
 Bolivia
-
 Botswana
-
 Brazil
-
 Brunei
-
 Bulgaria
-
 Cambodia
-
 Cameroon
-
 Canada
-
 Chile
Chile
-
 China
China
-
 Colombia
-
 Congo
Congo
-
 Costa Rica
-
 Cote d'Ivoire
-
 Croatia
-
 Cuba
Cuba
-
 Cyprus
-
 Czechia
-
 DR Congo
-
 Denmark
-
 Dominican Republic
-
 Ecuador
-
 Egypt
Egypt
-
 El Salvador
-
 Estonia
-
 Eswatini
-
 Ethiopia
-
 Finland
-
 France
-
 Georgia
-
 Germany
-
 Ghana
Ghana
-
 Greece
-
 Haiti
Haiti
-
 Hong Kong
-
 Hungary
-
 India
India
-
 Indonesia
-
 Iran, Islamic republic
-
 Iraq
Iraq
-
 Ireland
-
 Israel
-
 Italy
Italy
-
 Jamaica
-
 Japan
Japan
-
 Jordan
-
 Kazakhstan
-
 Kenya
Kenya
-
 Korea
Korea
-
 Kuwait
-
 Kyrgyzstan
-
 Laos
Laos
-
 Latvia
-
 Lebanon
-
 Lesotho
-
 Libya
Libya
-
 Lithuania
-
 Luxembourg
-
 Madagascar
-
 Malaysia
-
 Malta
Malta
-
 Mauritius
-
 Mexico
-
 Moldova
-
 Mongolia
-
 Montenegro
-
 Morocco
-
 Mozambique
-
 Myanmar
-
 Namibia
-
 Nepal
Nepal
-
 Netherlands
-
 New Zealand
-
 Nigeria
-
 North Macedonia
-
 Norway
-
 Oman
Oman
-
 Pakistan
-
 Palestine
-
 Panama
-
 Papua New Guinea
-
 Paraguay
-
 Peru
Peru
-
 Philippines
-
 Poland
-
 Portugal
-
 Puerto Rico
-
 Qatar
Qatar
-
 Reunion
-
 Romania
-
 Rwanda
-
 Saudi Arabia
-
 Serbia
-
 Singapore
-
 Slovakia
-
 Slovenia
-
 Somalia
-
 South Africa
-
 Spain
Spain
-
 Sri Lanka
-
 Sweden
-
 Switzerland
-
 Syria
Syria
-
 Taiwan
-
 Tajikistan
-
 Tanzania
-
 Thailand
-
 Trinidad and Tobago
-
 Tunisia
-
 Turkey
-
 UAE
UAE
-
 Uganda
-
 Ukraine
-
 United Kingdom
-
United States
-
 Uruguay
-
 Uzbekistan
-
 Venezuela
-
 Vietnam
-
 Yemen
Yemen
-
 Zambia
-
 Zimbabwe
- Forex
- Crypto
