
Nvidia stock gains as price holds well above key moving averages: weekly outlook

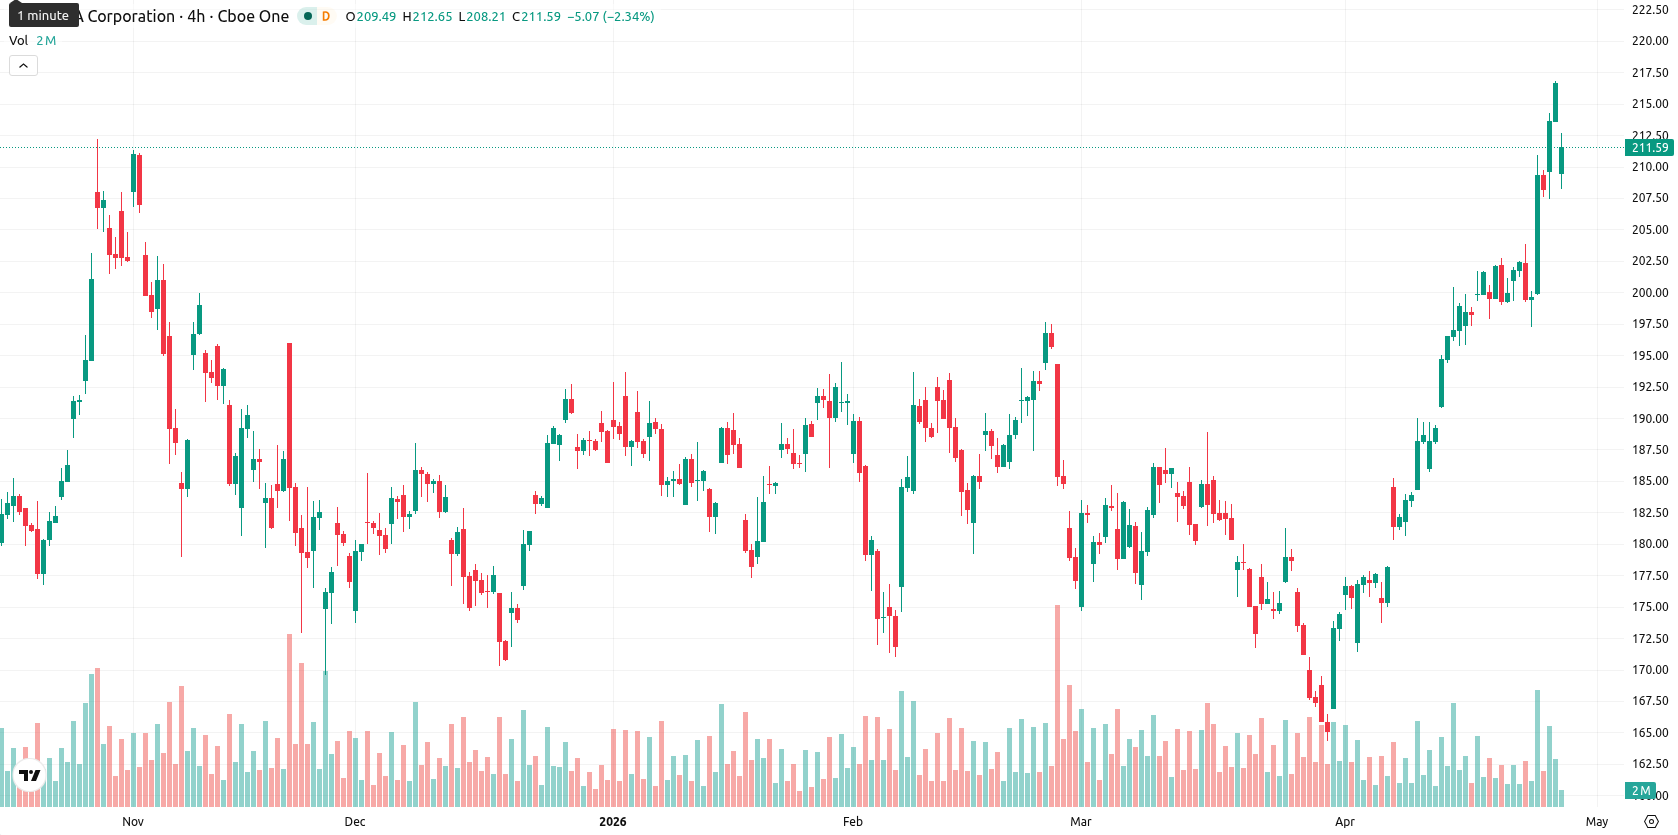
NVIDIA Corporation (NVDA) closed the week at $212.57, rising by $4.49 or 2.34% over the last seven trading days. The price remains well above the weekly MA-20 ($186.84), MA-50 ($177.61), and MA-200 ($96.25), confirming a strong bullish structure and positioning NVDA in the upper part of its weekly range.
Highlights
- Nvidia maintains a strong bullish trend with prices well above key moving averages, suggesting solid medium- and long-term momentum.
- Multiple technical indicators signal the stock is in overbought territory, raising the risk of a short-term pullback or profit-taking.
- Price is expected to oscillate between $204.33 and $220.81 in the coming week, with equal odds for upside or downside movement.
Partnership announcements and executive transition drive positive sentiment this week
Nvidia reported several confirmed corporate actions, including new partnerships with Adobe and WPP to integrate agentic AI into enterprise marketing solutions. The company expanded its industry collaborations across nuclear energy, healthcare, and automotive platforms. Additionally, Nvidia announced that its vice president and chief accounting officer, Donald Robertson, will retire effective May 4, 2026.
Sustained upward momentum as overbought signals prompt reversal caution
On the weekly chart, NVDA trades solidly above all key moving averages, with the MA-20 and MA-50 providing dynamic support. Weekly momentum indicators such as MACD remain on a buy signal, while the ADX reads as neutral, supporting steady, moderate upward momentum. Overbought conditions are flagged across oscillators — RSI at 68.46, CCI at 273.91, Stochastic RSI at 100, and Bull/Bear Power at 26.10 — reflecting strong dominance by buyers but also signaling caution for potential reversals.
Sideways bias expected amid overbought readings and breakout risk next week
Over the next seven trading days, NVDA is expected to consolidate within a range of $204.33 to $220.81, based on recent weekly volatility and momentum indicators. While buyers remain in control, the overbought signals suggest a balance of probabilities between further upside and a near-term pullback. The baseline scenario is for sideways action near current levels, but a break above $220.81 could see another bullish extension if momentum persists. Conversely, a dip below $204.33 may trigger additional profit-taking as overbought conditions unwind.
Earlier, analysts noted that while Nvidia’s technical momentum remained strong, heightened volatility and geopolitical risks warranted investor caution and suggested the potential for a directional breakout. The current analysis reinforces this cautious optimism, highlighting that traders should monitor a sustained move beyond $220.81 or below $204.33 for early signals of the next meaningful trend.


-
 Afghanistan
-
 Albania
-
 Algeria
-
 Angola
-
 Argentina
-
 Armenia
-
 Australia
-
 Austria
-
 Azerbaijan
-
 Bahamas
-
 Bahrain
-
 Bangladesh
-
 Belarus
-
 Belgium
-
 Bolivia
-
 Botswana
-
 Brazil
-
 Brunei
-
 Bulgaria
-
 Cambodia
-
 Cameroon
-
 Canada
-
 Chile
Chile
-
 China
China
-
 Colombia
-
 Congo
Congo
-
 Costa Rica
-
 Cote d'Ivoire
-
 Croatia
-
 Cuba
Cuba
-
 Cyprus
-
 Czechia
-
 DR Congo
-
 Denmark
-
 Dominican Republic
-
 Ecuador
-
 Egypt
Egypt
-
 El Salvador
-
 Estonia
-
 Eswatini
-
 Ethiopia
-
 Finland
-
 France
-
 Georgia
-
 Germany
-
 Ghana
Ghana
-
 Greece
-
 Haiti
Haiti
-
 Hong Kong
-
 Hungary
-
 India
India
-
 Indonesia
-
 Iran, Islamic republic
-
 Iraq
Iraq
-
 Ireland
-
 Israel
-
 Italy
Italy
-
 Jamaica
-
 Japan
Japan
-
 Jordan
-
 Kazakhstan
-
 Kenya
Kenya
-
 Korea
Korea
-
 Kuwait
-
 Kyrgyzstan
-
 Laos
Laos
-
 Latvia
-
 Lebanon
-
 Lesotho
-
 Libya
Libya
-
 Lithuania
-
 Luxembourg
-
 Madagascar
-
 Malaysia
-
 Malta
Malta
-
 Mauritius
-
 Mexico
-
 Moldova
-
 Mongolia
-
 Montenegro
-
 Morocco
-
 Mozambique
-
 Myanmar
-
 Namibia
-
 Nepal
Nepal
-
 Netherlands
-
 New Zealand
-
 Nigeria
-
 North Macedonia
-
 Norway
-
 Oman
Oman
-
 Pakistan
-
 Palestine
-
 Panama
-
 Papua New Guinea
-
 Paraguay
-
 Peru
Peru
-
 Philippines
-
 Poland
-
 Portugal
-
 Puerto Rico
-
 Qatar
Qatar
-
 Reunion
-
 Romania
-
 Rwanda
-
 Saudi Arabia
-
 Serbia
-
 Singapore
-
 Slovakia
-
 Slovenia
-
 Somalia
-
 South Africa
-
 Spain
Spain
-
 Sri Lanka
-
 Sweden
-
 Switzerland
-
 Syria
Syria
-
 Taiwan
-
 Tajikistan
-
 Tanzania
-
 Thailand
-
 Trinidad and Tobago
-
 Tunisia
-
 Turkey
-
 UAE
UAE
-
 Uganda
-
 Ukraine
-
 United Kingdom
-
United States
-
 Uruguay
-
 Uzbekistan
-
 Venezuela
-
 Vietnam
-
 Yemen
Yemen
-
 Zambia
-
 Zimbabwe
- Forex
- Crypto
