
Microsoft stock edges lower amid strong technical support at $398: weekly analysis

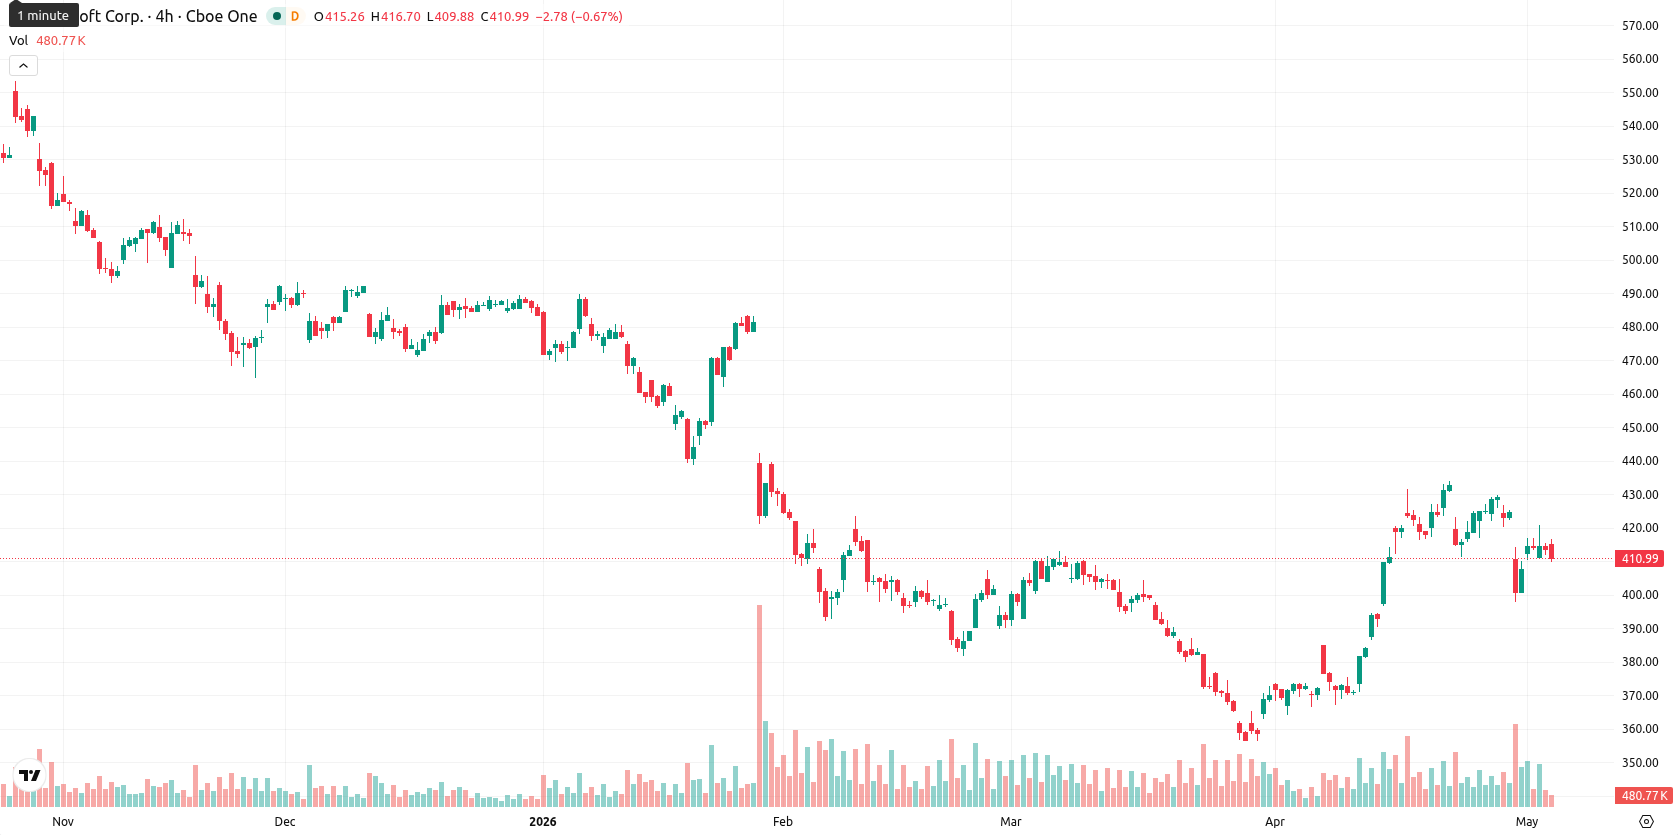
Microsoft Corporation (MSFT) ended the week down $2.53, or 0.85%, with price action remaining in the middle of the weekly range amid 7.24% volatility. The asset is currently trading below its weekly MA-20 ($417.42) and MA-50 ($467.35), but holds well above the MA-200 ($382.48), signaling near-term selling pressure while maintaining a longer-term bullish structure.
Highlights
- Microsoft faces near-term selling pressure as it trades below key short-term moving averages, signaling consolidation after recent declines.
- Momentum and trend indicators remain decisively bearish, with no key buy signals and negative sentiment dominating the technical outlook.
- The stock is expected to trade in a sideways range between $398 support and $425 resistance over the next week, with further downside risk prevailing.
Sentiment boosted by earnings beat and robust Copilot enterprise deals
Microsoft reported strong fiscal Q3 2026 results, with total revenue increasing 18% year-over-year to $82.9 billion and diluted EPS rising to $4.27, both above expectations. Growth was supported by Azure and accelerating adoption of Microsoft 365 Copilot, highlighted by large enterprise deals like Accenture’s Copilot rollout for 740,000 employees and a 250% surge in paid seats. The company’s capital spending on AI infrastructure and recent changes to its OpenAI partnership also influenced the overall sentiment.
Bearish technical signals as sellers dominate despite support holding
On the weekly chart, Microsoft remains below its MA-20 and MA-50, suggesting a downside bias in the near term, but price still trades comfortably above the MA-200, which acts as strong support at $382.48. Indicators are mostly negative: MACD signals a Strong Sell, ADX is bearish, and the RSI trend is downward, all indicating sellers remain in control. The Stochastic RSI and Bull/Bear Power point to overbought conditions, while CCI and the Awesome Oscillator stay neutral, reinforcing the sense of consolidation. Key weekly support is found at $398, with resistance at $425.
Range-bound outlook as weak momentum limits breakout potential this week
Over the next five trading days, Microsoft is expected to remain range-bound, with the price likely oscillating between support at $398 and resistance at $425. The probability of a sustained move higher appears low, under 20%, given no buy signals from the major weekly indicators. The baseline scenario suggests ongoing sideways movement within this corridor; a breakout above $425 might trigger a move towards the MA-20, while a breakdown below $398 would expose the $385 — $390 support zone.
Earlier, analysts noted that Microsoft faced persistent near-term downside risks tied to regulatory pressures, AI strategy uncertainty, and bearish technical signals. The latest results reinforce this cautious outlook, as ongoing consolidation and prevailing negative momentum suggest traders should closely monitor the $398 support for signs of renewed volatility.


Latest Microsoft News


-
 Afghanistan
-
 Albania
-
 Algeria
-
 Angola
-
 Argentina
-
 Armenia
-
 Australia
-
 Austria
-
 Azerbaijan
-
 Bahamas
-
 Bahrain
-
 Bangladesh
-
 Belarus
-
 Belgium
-
 Bolivia
-
 Botswana
-
 Brazil
-
 Brunei
-
 Bulgaria
-
 Cambodia
-
 Cameroon
-
 Canada
-
 Chile
Chile
-
 China
China
-
 Colombia
-
 Congo
Congo
-
 Costa Rica
-
 Cote d'Ivoire
-
 Croatia
-
 Cuba
Cuba
-
 Cyprus
-
 Czechia
-
 DR Congo
-
 Denmark
-
 Dominican Republic
-
 Ecuador
-
 Egypt
Egypt
-
 El Salvador
-
 Estonia
-
 Eswatini
-
 Ethiopia
-
 Finland
-
 France
-
 Georgia
-
 Germany
-
 Ghana
Ghana
-
 Greece
-
 Haiti
Haiti
-
 Hong Kong
-
 Hungary
-
 India
India
-
 Indonesia
-
 Iran, Islamic republic
-
 Iraq
Iraq
-
 Ireland
-
 Israel
-
 Italy
Italy
-
 Jamaica
-
 Japan
Japan
-
 Jordan
-
 Kazakhstan
-
 Kenya
Kenya
-
 Korea
Korea
-
 Kuwait
-
 Kyrgyzstan
-
 Laos
Laos
-
 Latvia
-
 Lebanon
-
 Lesotho
-
 Libya
Libya
-
 Lithuania
-
 Luxembourg
-
 Madagascar
-
 Malaysia
-
 Malta
Malta
-
 Mauritius
-
 Mexico
-
 Moldova
-
 Mongolia
-
 Montenegro
-
 Morocco
-
 Mozambique
-
 Myanmar
-
 Namibia
-
 Nepal
Nepal
-
 Netherlands
-
 New Zealand
-
 Nigeria
-
 North Macedonia
-
 Norway
-
 Oman
Oman
-
 Pakistan
-
 Palestine
-
 Panama
-
 Papua New Guinea
-
 Paraguay
-
 Peru
Peru
-
 Philippines
-
 Poland
-
 Portugal
-
 Puerto Rico
-
 Qatar
Qatar
-
 Reunion
-
 Romania
-
 Rwanda
-
 Saudi Arabia
-
 Serbia
-
 Singapore
-
 Slovakia
-
 Slovenia
-
 Somalia
-
 South Africa
-
 Spain
Spain
-
 Sri Lanka
-
 Sweden
-
 Switzerland
-
 Syria
Syria
-
 Taiwan
-
 Tajikistan
-
 Tanzania
-
 Thailand
-
 Trinidad and Tobago
-
 Tunisia
-
 Turkey
-
 UAE
UAE
-
 Uganda
-
 Ukraine
-
 United Kingdom
-
United States
-
 Uruguay
-
 Uzbekistan
-
 Venezuela
-
 Vietnam
-
 Yemen
Yemen
-
 Zambia
-
 Zimbabwe
- Forex
- Crypto
