
Texas Instruments stock price forecast: $308.00 resistance tested as TXN jumps 3.50%

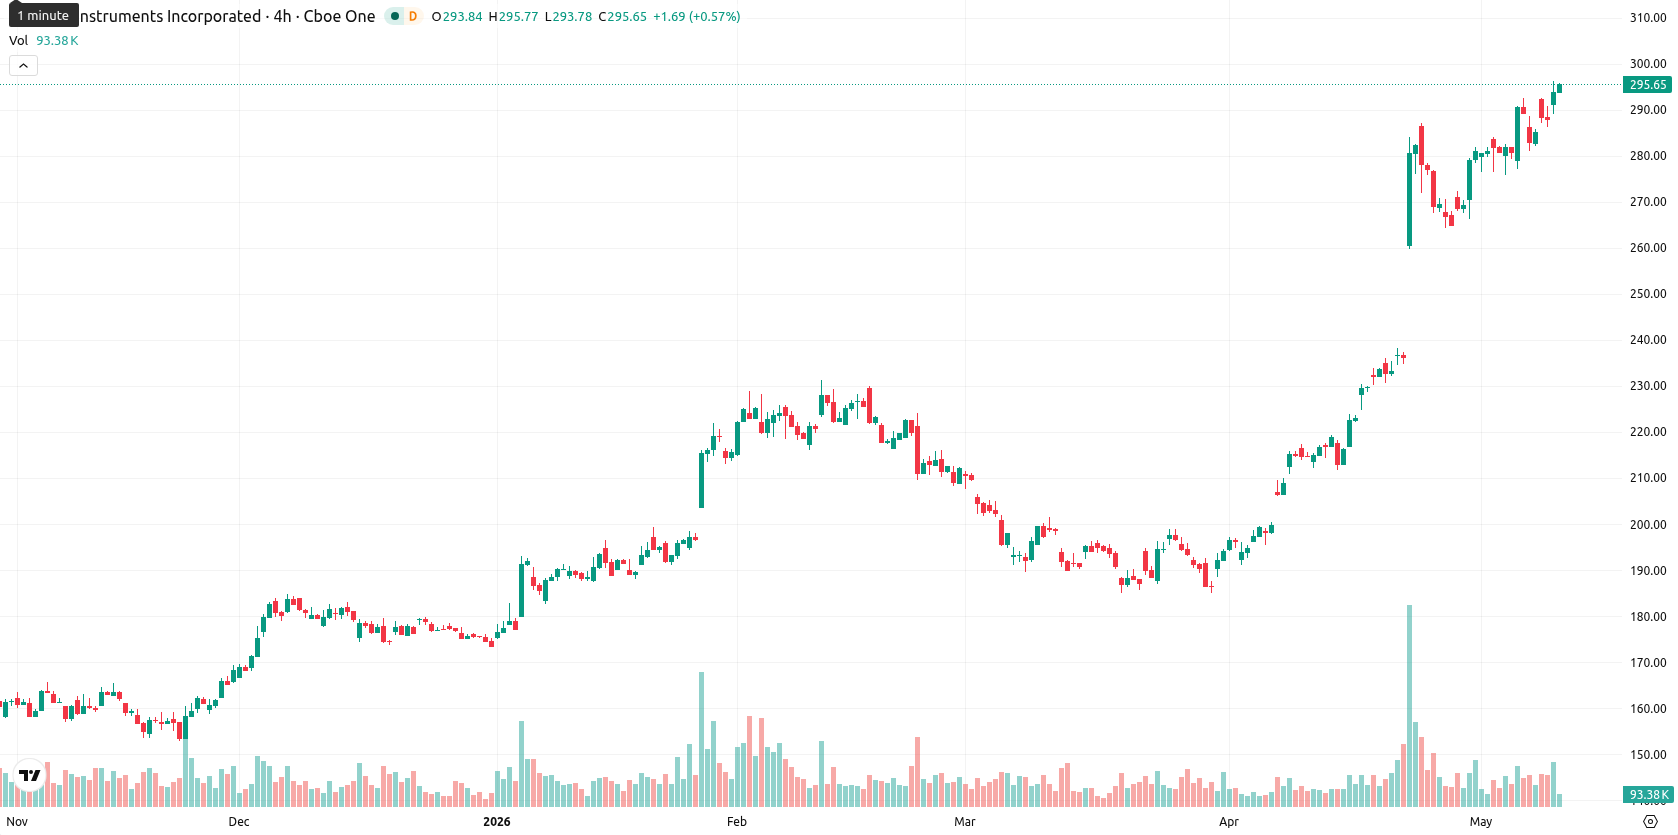
Texas Instruments Incorporated (TXN) is trading at $297.88, posting a 3.50% gain on the day. The price sits well above its key moving averages, indicating upside momentum across short, medium, and long-term timeframes.
Highlights
- Securian Asset Management reduced its Texas Instruments holdings by 43.7% in Q4, increasing available public float.
- This shift in investor composition could elevate trading activity and attract new institutional or retail interest in TXN shares.
- Texas Instruments maintains strong bullish momentum, with price action likely in the $289.00–$308.00 range and a high probability of further upside.
Investor composition shifts as reduced holdings fuel float expansion
Securian Asset Management Inc. recently disclosed a 43.7% reduction in its holdings of Texas Instruments during the fourth quarter, according to a Form 13F filing submitted to the SEC. This shift increases the available public float and may invite greater interest from new institutional or retail investors seeking exposure amid strong performance trends. The adjustment in investor composition could amplify trading activity as market participants reposition around TXN shares.
Overbought signals cluster as technicals warn of extended rally
Turning to technical levels, Texas Instruments is trading substantially above its MA-20 ($257.88), MA-50 ($221.54), and MA-200 ($194.88), with Ichimoku Kijun support marked at $241.99. Momentum indicators are all flagging robust buy signals — both MACD and ADX confirm prevailing upside, while RSI sits in overbought territory on daily and weekly timeframes. In the near term, both Stoch RSI and CCI highlight continued overbought conditions, and BBP signals dominant buyer pressure intraday. The Awesome Oscillator is neutral; however, the indicator picture as a whole warns that the market is extended, especially as TXN trades near the session high after a gap up, reflecting elevated volatility.
Breakout risk rises as trend momentum supports upside scenario
Over the next five sessions, TXN is expected to move within a $289.00 to $308.00 volatility band relative to its current price, based on recent trading ranges. With a high probability (over 80%) of further price gains supported by weekly trend indicators, upside could see a breakout beyond $308, potentially targeting new highs. A baseline scenario would be range-bound consolidation between $295 and $305 as the market absorbs this recent strength. Should momentum fail, retracements toward support near $289 remain possible, albeit less likely given current technical breadth.
Earlier, analysts noted that Texas Instruments was maintaining strong bullish momentum while technical signals warned of potential overbought conditions. The latest reduction in holdings by a major institutional investor, alongside continued strength in technical indicators, adds nuance to the bullish outlook and suggests that traders should watch for heightened volatility as the market digests shifting investor participation.


Latest Texas Instruments News


-
 Afghanistan
-
 Albania
-
 Algeria
-
 Angola
-
 Argentina
-
 Armenia
-
 Australia
-
 Austria
-
 Azerbaijan
-
 Bahamas
-
 Bahrain
-
 Bangladesh
-
 Belarus
-
 Belgium
-
 Bolivia
-
 Botswana
-
 Brazil
-
 Brunei
-
 Bulgaria
-
 Cambodia
-
 Cameroon
-
 Canada
-
 Chile
Chile
-
 China
China
-
 Colombia
-
 Congo
Congo
-
 Costa Rica
-
 Cote d'Ivoire
-
 Croatia
-
 Cuba
Cuba
-
 Cyprus
-
 Czechia
-
 DR Congo
-
 Denmark
-
 Dominican Republic
-
 Ecuador
-
 Egypt
Egypt
-
 El Salvador
-
 Estonia
-
 Eswatini
-
 Ethiopia
-
 Finland
-
 France
-
 Georgia
-
 Germany
-
 Ghana
Ghana
-
 Greece
-
 Haiti
Haiti
-
 Hong Kong
-
 Hungary
-
 India
India
-
 Indonesia
-
 Iran, Islamic republic
-
 Iraq
Iraq
-
 Ireland
-
 Israel
-
 Italy
Italy
-
 Jamaica
-
 Japan
Japan
-
 Jordan
-
 Kazakhstan
-
 Kenya
Kenya
-
 Korea
Korea
-
 Kuwait
-
 Kyrgyzstan
-
 Laos
Laos
-
 Latvia
-
 Lebanon
-
 Lesotho
-
 Libya
Libya
-
 Lithuania
-
 Luxembourg
-
 Madagascar
-
 Malaysia
-
 Malta
Malta
-
 Mauritius
-
 Mexico
-
 Moldova
-
 Mongolia
-
 Montenegro
-
 Morocco
-
 Mozambique
-
 Myanmar
-
 Namibia
-
 Nepal
Nepal
-
 Netherlands
-
 New Zealand
-
 Nigeria
-
 North Macedonia
-
 Norway
-
 Oman
Oman
-
 Pakistan
-
 Palestine
-
 Panama
-
 Papua New Guinea
-
 Paraguay
-
 Peru
Peru
-
 Philippines
-
 Poland
-
 Portugal
-
 Puerto Rico
-
 Qatar
Qatar
-
 Reunion
-
 Romania
-
 Rwanda
-
 Saudi Arabia
-
 Serbia
-
 Singapore
-
 Slovakia
-
 Slovenia
-
 Somalia
-
 South Africa
-
 Spain
Spain
-
 Sri Lanka
-
 Sweden
-
 Switzerland
-
 Syria
Syria
-
 Taiwan
-
 Tajikistan
-
 Tanzania
-
 Thailand
-
 Trinidad and Tobago
-
 Tunisia
-
 Turkey
-
 UAE
UAE
-
 Uganda
-
 Ukraine
-
 United Kingdom
-
United States
-
 Uruguay
-
 Uzbekistan
-
 Venezuela
-
 Vietnam
-
 Yemen
Yemen
-
 Zambia
-
 Zimbabwe
- Forex
- Crypto
