
Detailed Q1 earnings call sends AMD stock down 3.41%

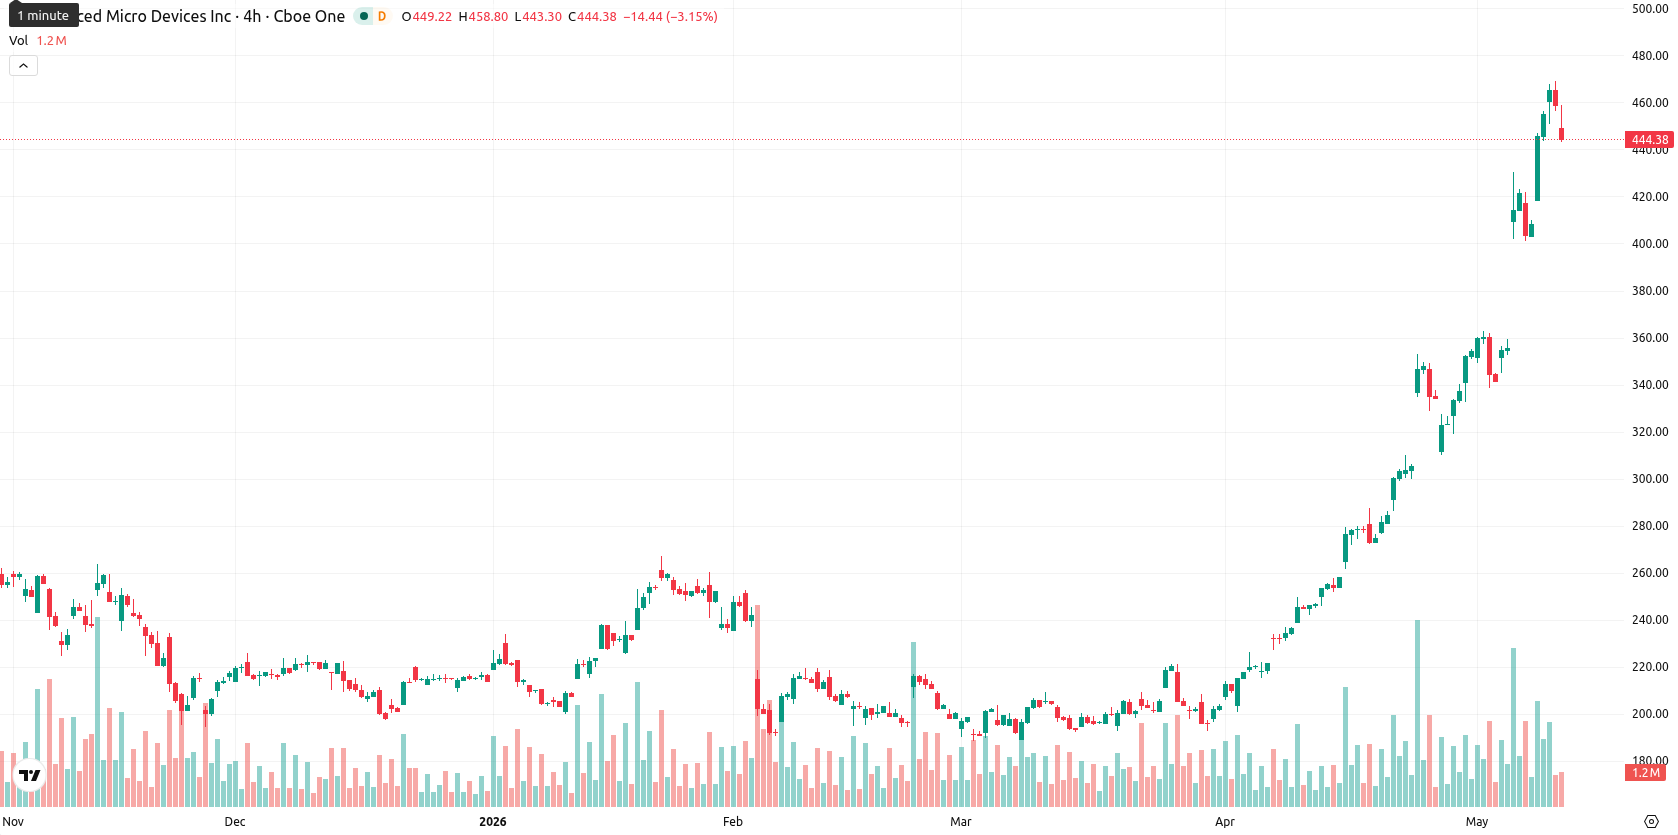
Advanced Micro Devices (AMD) is trading at $443.15, marking a daily decline of 3.41%. The price remains well above its key moving averages, reflecting underlying momentum despite today's setback.
Highlights
- AMD's Q1 earnings call provided expanded financial disclosures and management commentary, offering deeper insight into operational performance for investors.
- Despite increased transparency and detailed quarterly reporting, AMD shares continue to face sustained selling pressure in the broader market context.
- Technical signals point to ongoing bullish momentum but also overbought conditions, with AMD forecast to consolidate between $420 and $465 over the next week.
Expanded transparency as earnings release boosts operational insight
The Globe and Mail published a detailed summary of AMD's Q1 earnings call, offering updated financial data, company charting, and the published record of management's responses to analyst questions. This release increases the availability of company information, providing investors and traders with enhanced insight into operational performance and key corporate disclosures. The dissemination of these results has given market participants additional context on AMD's recent quarter, though price action has remained under broader selling pressure.
Bullish momentum persists as overbought signals and support converge
The price sits well above technical levels, with the SMA-20 at $336.85, SMA-50 at $259.69, and SMA-200 at $218.83. The Ichimoku Kijun on the daily timeframe provides immediate support at $342.24. Momentum indicators show strong trends, as MACD and ADX remain bullish. However, the RSI at 80.99 and CCI at 175.06 indicate sharply overbought conditions. BBP readings and the close near today's intraday low reflect ongoing selling pressure, even as underlying momentum remains positive.
Consolidation outlook as volatility bands define near-term risk
Over the next five trading days, the typical volatility band is projected between $420 and $465. The baseline scenario calls for consolidation within this range. A sustained move above $465 could trigger renewed buying, while a pullback below $420 may accelerate profit-taking and initiate a deeper retracement, despite the presence of longer-term support.
Previously it was reported that AMD maintained strong bullish momentum with technical signals supporting sustained buyer control and optimism about further upside. With the latest Q1 earnings insights now integrated and volatility elevated, traders should monitor for a decisive move beyond $465 as a potential catalyst for renewed strength, while a drop below $420 could signal increasing retracement risk.


Latest AMD News


-
 Afghanistan
-
 Albania
-
 Algeria
-
 Angola
-
 Argentina
-
 Armenia
-
 Australia
-
 Austria
-
 Azerbaijan
-
 Bahamas
-
 Bahrain
-
 Bangladesh
-
 Belarus
-
 Belgium
-
 Bolivia
-
 Botswana
-
 Brazil
-
 Brunei
-
 Bulgaria
-
 Cambodia
-
 Cameroon
-
 Canada
-
 Chile
Chile
-
 China
China
-
 Colombia
-
 Congo
Congo
-
 Costa Rica
-
 Cote d'Ivoire
-
 Croatia
-
 Cuba
Cuba
-
 Cyprus
-
 Czechia
-
 DR Congo
-
 Denmark
-
 Dominican Republic
-
 Ecuador
-
 Egypt
Egypt
-
 El Salvador
-
 Estonia
-
 Eswatini
-
 Ethiopia
-
 Finland
-
 France
-
 Georgia
-
 Germany
-
 Ghana
Ghana
-
 Greece
-
 Haiti
Haiti
-
 Hong Kong
-
 Hungary
-
 India
India
-
 Indonesia
-
 Iran, Islamic republic
-
 Iraq
Iraq
-
 Ireland
-
 Israel
-
 Italy
Italy
-
 Jamaica
-
 Japan
Japan
-
 Jordan
-
 Kazakhstan
-
 Kenya
Kenya
-
 Korea
Korea
-
 Kuwait
-
 Kyrgyzstan
-
 Laos
Laos
-
 Latvia
-
 Lebanon
-
 Lesotho
-
 Libya
Libya
-
 Lithuania
-
 Luxembourg
-
 Madagascar
-
 Malaysia
-
 Malta
Malta
-
 Mauritius
-
 Mexico
-
 Moldova
-
 Mongolia
-
 Montenegro
-
 Morocco
-
 Mozambique
-
 Myanmar
-
 Namibia
-
 Nepal
Nepal
-
 Netherlands
-
 New Zealand
-
 Nigeria
-
 North Macedonia
-
 Norway
-
 Oman
Oman
-
 Pakistan
-
 Palestine
-
 Panama
-
 Papua New Guinea
-
 Paraguay
-
 Peru
Peru
-
 Philippines
-
 Poland
-
 Portugal
-
 Puerto Rico
-
 Qatar
Qatar
-
 Reunion
-
 Romania
-
 Rwanda
-
 Saudi Arabia
-
 Serbia
-
 Singapore
-
 Slovakia
-
 Slovenia
-
 Somalia
-
 South Africa
-
 Spain
Spain
-
 Sri Lanka
-
 Sweden
-
 Switzerland
-
 Syria
Syria
-
 Taiwan
-
 Tajikistan
-
 Tanzania
-
 Thailand
-
 Trinidad and Tobago
-
 Tunisia
-
 Turkey
-
 UAE
UAE
-
 Uganda
-
 Ukraine
-
 United Kingdom
-
United States
-
 Uruguay
-
 Uzbekistan
-
 Venezuela
-
 Vietnam
-
 Yemen
Yemen
-
 Zambia
-
 Zimbabwe
- Forex
- Crypto
