

AMD shares technical analysis: Sellers dominate short-term trend

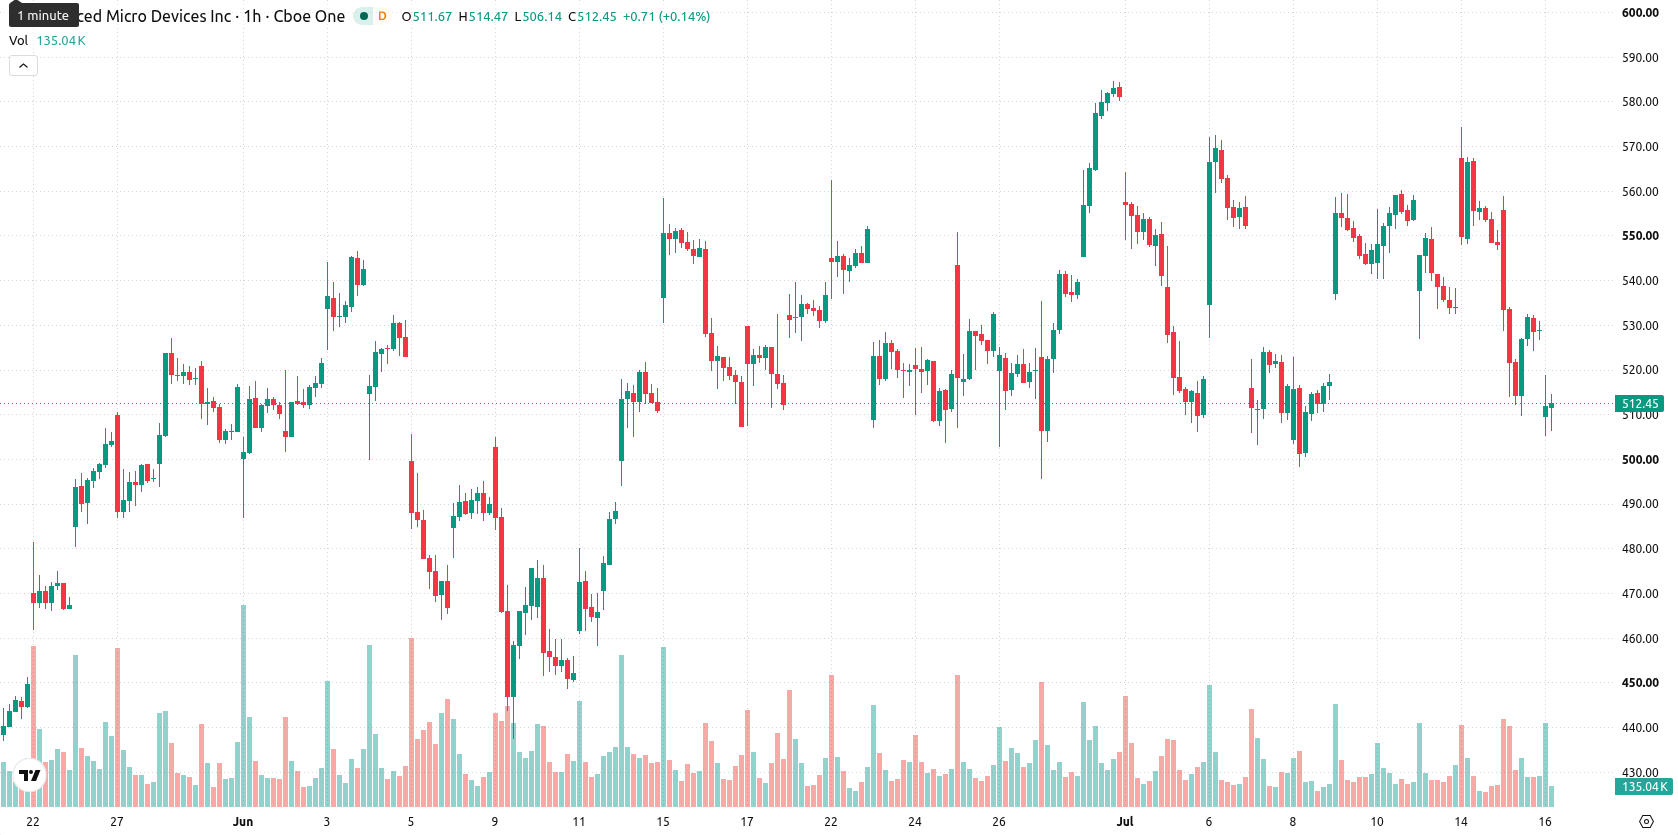
Advanced Micro Devices, Inc. (AMD) stock is trading at $511.05, down 3.39% on the day. The price currently sits below its key moving averages in the short and mid-term, indicating moderate downward pressure relative to recent levels.
 606.18
647.86
606.18
647.86
Highlights
- AMD faces strong near-term and mid-term downside pressure as it trades below key moving averages on the hourly chart.
- Bearish momentum dominates with RSI, CCI, and MACD signaling sell conditions, while volatility remains moderate and oscillators show mixed signals.
- AMD is likely to remain in a $482.48 to $539.62 range; a downside break is favored unless resistance at $541.89 is cleared.
Selling dominance confirmed as major signals flash bearish
On the H1 timeframe, AMD trades below both the MA-20 at $539.88 and MA-50 at $536.57, while it remains well above the MA-200 on the daily chart at $293.28. The Ichimoku Kijun acts as immediate resistance at $541.89. Relative Strength Index (RSI) and Commodity Channel Index (CCI) both indicate a sell signal, confirmed by a bearish reading from the Moving Average Convergence Divergence (MACD); the Average Directional Index (ADX), Stochastic RSI, and Awesome Oscillator all show neutral momentum. Bull/Bear Power indicates an oversold condition, underscoring ongoing selling dominance within current intraday trading.
Low rebound odds as price trapped in broad trading range
In the short term, AMD is likely to remain in a broad sideways corridor, with expected range boundaries between $482.48 and $539.62. The probability of a substantial upward rebound is very low, while the likelihood of further declines remains elevated. Sustained upside would require a decisive break above the $541.89 resistance, whereas a move below $482.48 could trigger renewed bearish extension.
Earlier, analysts noted that AMD remained resilient relative to sector peers, even as profit-taking and increased market volatility raised the risk of a deeper correction. The latest technical signals now strengthen this cautionary outlook, making a sustained break above the $541.89 resistance a pivotal requirement before any meaningful recovery can be anticipated.











-
 Afghanistan
-
 Albania
-
 Algeria
-
 Angola
-
 Argentina
-
 Armenia
-
 Australia
-
 Austria
-
 Azerbaijan
-
 Bahamas
-
 Bahrain
-
 Bangladesh
-
 Belarus
-
 Belgium
-
 Bolivia
-
 Botswana
-
 Brazil
-
 Brunei
-
 Bulgaria
-
 Cambodia
-
 Cameroon
-
 Canada
-
 Chile
Chile
-
 China
China
-
 Colombia
-
 Congo
Congo
-
 Costa Rica
-
 Cote d'Ivoire
-
 Croatia
-
 Cuba
Cuba
-
 Cyprus
-
 Czechia
-
 DR Congo
-
 Denmark
-
 Dominican Republic
-
 Ecuador
-
 Egypt
Egypt
-
 El Salvador
-
 Estonia
-
 Eswatini
-
 Ethiopia
-
 Finland
-
 France
-
 Georgia
-
 Germany
-
 Ghana
Ghana
-
 Greece
-
 Haiti
Haiti
-
 Hong Kong
-
 Hungary
-
 India
India
-
 Indonesia
-
 Iran, Islamic republic
-
 Iraq
Iraq
-
 Ireland
-
 Israel
-
 Italy
Italy
-
 Jamaica
-
 Japan
Japan
-
 Jordan
-
 Kazakhstan
-
 Kenya
Kenya
-
 Korea
Korea
-
 Kuwait
-
 Kyrgyzstan
-
 Laos
Laos
-
 Latvia
-
 Lebanon
-
 Lesotho
-
 Libya
Libya
-
 Lithuania
-
 Luxembourg
-
 Madagascar
-
 Malaysia
-
 Malta
Malta
-
 Mauritius
-
 Mexico
-
 Moldova
-
 Mongolia
-
 Montenegro
-
 Morocco
-
 Mozambique
-
 Myanmar
-
 Namibia
-
 Nepal
Nepal
-
 Netherlands
-
 New Zealand
-
 Nigeria
-
 North Macedonia
-
 Norway
-
 Oman
Oman
-
 Pakistan
-
 Palestine
-
 Panama
-
 Papua New Guinea
-
 Paraguay
-
 Peru
Peru
-
 Philippines
-
 Poland
-
 Portugal
-
 Puerto Rico
-
 Qatar
Qatar
-
 Reunion
-
 Romania
-
 Rwanda
-
 Saudi Arabia
-
 Serbia
-
 Singapore
-
 Slovakia
-
 Slovenia
-
 Somalia
-
 South Africa
-
 Spain
Spain
-
 Sri Lanka
-
 Sweden
-
 Switzerland
-
 Syria
Syria
-
 Taiwan
-
 Tajikistan
-
 Tanzania
-
 Thailand
-
 Trinidad and Tobago
-
 Tunisia
-
 Turkey
-
 UAE
UAE
-
 Uganda
-
 Ukraine
-
 United Kingdom
-
United States
-
 Uruguay
-
 Uzbekistan
-
 Venezuela
-
 Vietnam
-
 Yemen
Yemen
-
 Zambia
-
 Zimbabwe
- Forex
- Crypto












