
Broadcom stock edges lower with risk of near-term pullback indicated by Stochastic RSI: weekly review

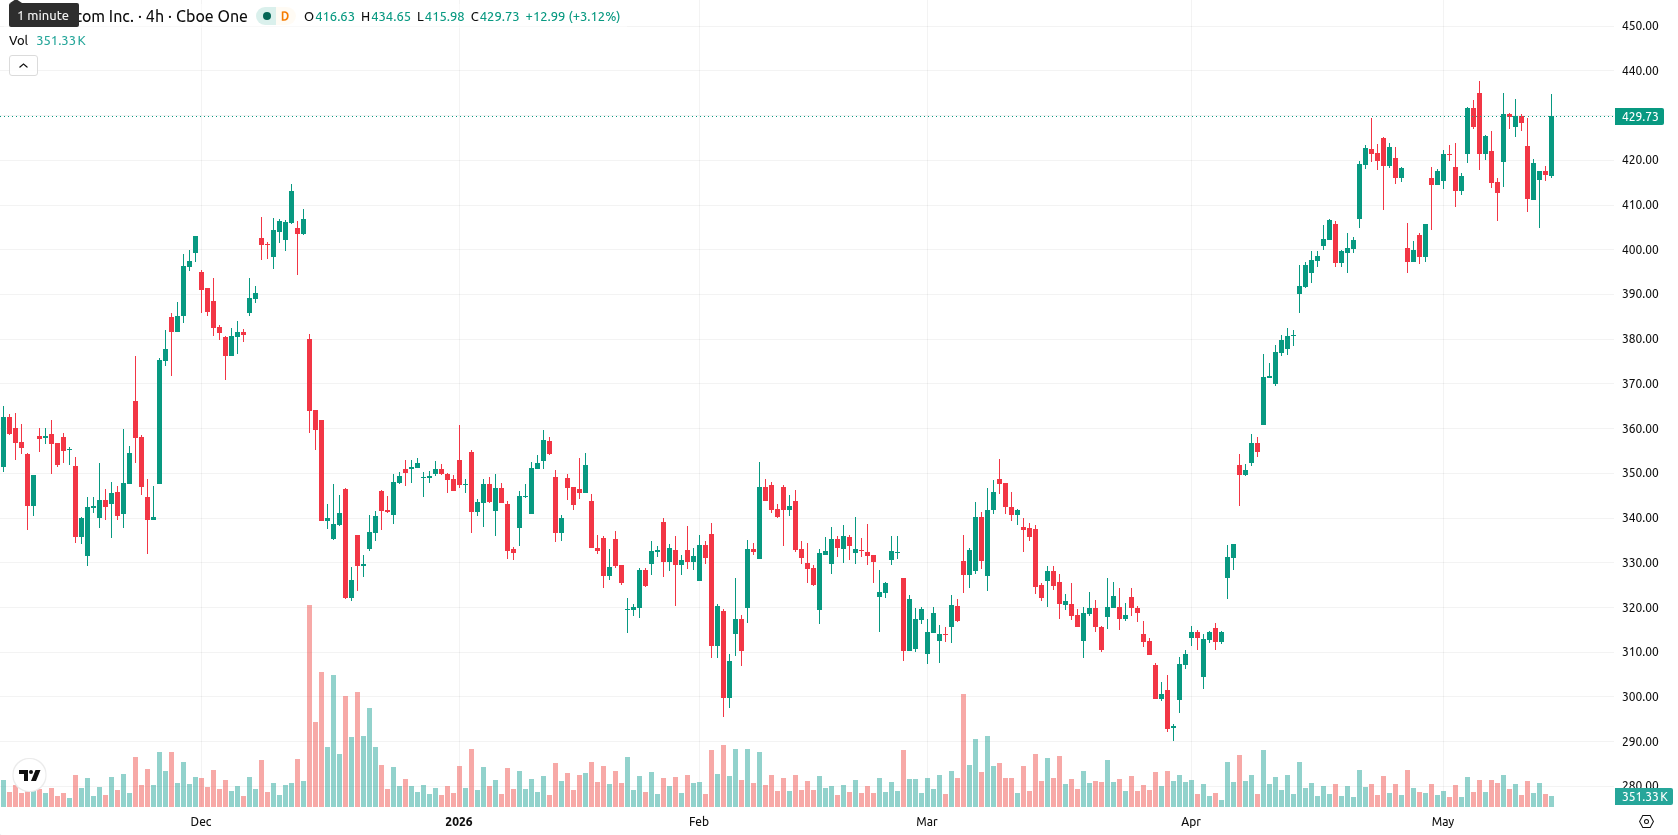
Broadcom Inc. (AVGO) is currently trading at $430.25, having slipped $0.80 (0.25%) over the past week but remaining at the very top of its weekly range. The asset continues to trade well above its weekly MA-20 ($352.51), MA-50 ($333.31), and MA-200 ($172.71), confirming a strong medium- and long-term bullish trend structure.
Highlights
- AVGO maintains a strong bullish structure, trading well above key moving averages and consolidating near resistance.
- Momentum indicators confirm an ongoing uptrend, but several oscillators are overbought, signaling increased risk of a short-term correction.
- Expected trading range for the next week is $413 to $447, with a 75% probability of further upside unless support at $413 fails.
Earnings anticipation and legal risks drive heightened attention this week
Broadcom is preparing to release its fiscal 2026 second-quarter earnings on June 3, which has drawn significant market attention. The company has initiated legal proceedings against EU regulators related to requests for VMware documents amid an ongoing antitrust investigation following its 2023 acquisition. In addition, Broadcom is in advanced talks for a $35 billion private credit facility to expand custom AI chip production, with major clients such as Google and Anthropic active in recent supply agreements.
Strong uptrend signaled amid overbought oscillators and consolidation risk
On the weekly chart, AVGO's momentum remains robust, supported by its position above all major moving averages, with the MA-50 acting as the nearest dynamic support and the Ichimoku Kijun too distant to serve as support for now. Weekly oscillators deliver mixed signals: the RSI is bullish at 65.62, but both the Stochastic RSI and CCI indicate deeply overbought levels. MACD, ADX, Bull/Bear Power, and the Awesome Oscillator all confirm a strong uptrend, yet the overbought status of key oscillators highlights an increased risk of short-term consolidation or corrective movement. Key support sits at $413, while resistance is focused near $447, with recent price action showing signs of consolidation following a period of heightened volatility and strong momentum divergence.
Breakout potential persists as volatility sustains bullish bias next week
Over the next five trading days, AVGO is expected to trade within the $413 to $447 range, reflecting both the current volatility and strong underlying uptrend. There is approximately a 75% probability of further gains, driven by favorable readings in the RSI, ADX, and MACD, though the risk of a near-term pullback remains elevated because the CCI and Stochastic RSI are overbought. The base scenario is for consolidation between $413 and $447, with a clear breakout above $447 opening the door to new short-term highs. A move below $413 would shift the technical outlook bearish and could prompt a deeper retracement toward intermediate support levels.
Earlier, analysts noted that Broadcom maintained a strong bullish technical structure, supported by positive momentum and ongoing interest in AI-driven growth. With mounting anticipation ahead of earnings, heightened legal activity in the EU, and ambitious AI expansion plans, traders should monitor $447 as a pivotal resistance level for a potential breakout amid the current consolidation phase.


-
 Afghanistan
-
 Albania
-
 Algeria
-
 Angola
-
 Argentina
-
 Armenia
-
 Australia
-
 Austria
-
 Azerbaijan
-
 Bahamas
-
 Bahrain
-
 Bangladesh
-
 Belarus
-
 Belgium
-
 Bolivia
-
 Botswana
-
 Brazil
-
 Brunei
-
 Bulgaria
-
 Cambodia
-
 Cameroon
-
 Canada
-
 Chile
Chile
-
 China
China
-
 Colombia
-
 Congo
Congo
-
 Costa Rica
-
 Cote d'Ivoire
-
 Croatia
-
 Cuba
Cuba
-
 Cyprus
-
 Czechia
-
 DR Congo
-
 Denmark
-
 Dominican Republic
-
 Ecuador
-
 Egypt
Egypt
-
 El Salvador
-
 Estonia
-
 Eswatini
-
 Ethiopia
-
 Finland
-
 France
-
 Georgia
-
 Germany
-
 Ghana
Ghana
-
 Greece
-
 Haiti
Haiti
-
 Hong Kong
-
 Hungary
-
 India
India
-
 Indonesia
-
 Iran, Islamic republic
-
 Iraq
Iraq
-
 Ireland
-
 Israel
-
 Italy
Italy
-
 Jamaica
-
 Japan
Japan
-
 Jordan
-
 Kazakhstan
-
 Kenya
Kenya
-
 Korea
Korea
-
 Kuwait
-
 Kyrgyzstan
-
 Laos
Laos
-
 Latvia
-
 Lebanon
-
 Lesotho
-
 Libya
Libya
-
 Lithuania
-
 Luxembourg
-
 Madagascar
-
 Malaysia
-
 Malta
Malta
-
 Mauritius
-
 Mexico
-
 Moldova
-
 Mongolia
-
 Montenegro
-
 Morocco
-
 Mozambique
-
 Myanmar
-
 Namibia
-
 Nepal
Nepal
-
 Netherlands
-
 New Zealand
-
 Nigeria
-
 North Macedonia
-
 Norway
-
 Oman
Oman
-
 Pakistan
-
 Palestine
-
 Panama
-
 Papua New Guinea
-
 Paraguay
-
 Peru
Peru
-
 Philippines
-
 Poland
-
 Portugal
-
 Puerto Rico
-
 Qatar
Qatar
-
 Reunion
-
 Romania
-
 Rwanda
-
 Saudi Arabia
-
 Serbia
-
 Singapore
-
 Slovakia
-
 Slovenia
-
 Somalia
-
 South Africa
-
 Spain
Spain
-
 Sri Lanka
-
 Sweden
-
 Switzerland
-
 Syria
Syria
-
 Taiwan
-
 Tajikistan
-
 Tanzania
-
 Thailand
-
 Trinidad and Tobago
-
 Tunisia
-
 Turkey
-
 UAE
UAE
-
 Uganda
-
 Ukraine
-
 United Kingdom
-
United States
-
 Uruguay
-
 Uzbekistan
-
 Venezuela
-
 Vietnam
-
 Yemen
Yemen
-
 Zambia
-
 Zimbabwe
- Forex
- Crypto
